
Advertisement
- China
- /
- Medical Equipment
- /
- SHSE:688617
APT Medical Inc.'s (SHSE:688617) Recent Stock Performance Looks Decent- Can Strong Fundamentals Be the Reason?
APT Medical's (SHSE:688617) stock up by 9.5% over the past three months. Given its impressive performance, we decided to study the company's key financial indicators as a company's long-term fundamentals usually dictate market outcomes. Specifically, we decided to study APT Medical's ROE in this article.
Return on Equity or ROE is a test of how effectively a company is growing its value and managing investors’ money. In simpler terms, it measures the profitability of a company in relation to shareholder's equity.
See our latest analysis for APT Medical
How To Calculate Return On Equity?
The formula for ROE is:
Return on Equity = Net Profit (from continuing operations) ÷ Shareholders' Equity
So, based on the above formula, the ROE for APT Medical is:
27% = CN¥561m ÷ CN¥2.1b (Based on the trailing twelve months to March 2024).
The 'return' refers to a company's earnings over the last year. One way to conceptualize this is that for each CN¥1 of shareholders' capital it has, the company made CN¥0.27 in profit.
What Is The Relationship Between ROE And Earnings Growth?
So far, we've learned that ROE is a measure of a company's profitability. Depending on how much of these profits the company reinvests or "retains", and how effectively it does so, we are then able to assess a company’s earnings growth potential. Generally speaking, other things being equal, firms with a high return on equity and profit retention, have a higher growth rate than firms that don’t share these attributes.
APT Medical's Earnings Growth And 27% ROE
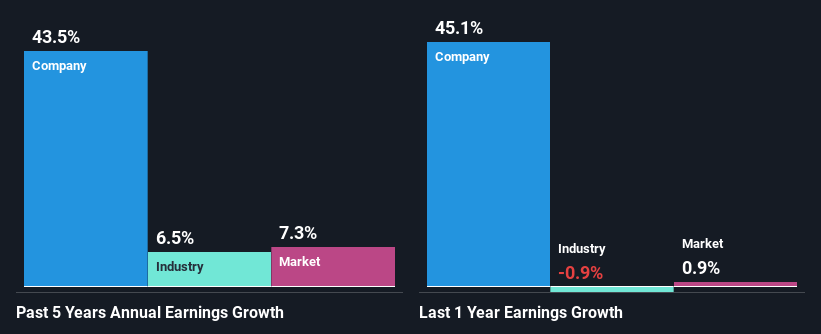
Firstly, we acknowledge that APT Medical has a significantly high ROE. Additionally, the company's ROE is higher compared to the industry average of 7.4% which is quite remarkable. So, the substantial 43% net income growth seen by APT Medical over the past five years isn't overly surprising.
We then compared APT Medical's net income growth with the industry and we're pleased to see that the company's growth figure is higher when compared with the industry which has a growth rate of 6.5% in the same 5-year period.
Earnings growth is a huge factor in stock valuation. It’s important for an investor to know whether the market has priced in the company's expected earnings growth (or decline). By doing so, they will have an idea if the stock is headed into clear blue waters or if swampy waters await. One good indicator of expected earnings growth is the P/E ratio which determines the price the market is willing to pay for a stock based on its earnings prospects. So, you may want to check if APT Medical is trading on a high P/E or a low P/E, relative to its industry.
Is APT Medical Making Efficient Use Of Its Profits?
APT Medical's ' three-year median payout ratio is on the lower side at 24% implying that it is retaining a higher percentage (76%) of its profits. So it seems like the management is reinvesting profits heavily to grow its business and this reflects in its earnings growth number.
Besides, APT Medical has been paying dividends over a period of three years. This shows that the company is committed to sharing profits with its shareholders.
Conclusion
In total, we are pretty happy with APT Medical's performance. In particular, it's great to see that the company is investing heavily into its business and along with a high rate of return, that has resulted in a sizeable growth in its earnings. With that said, the latest industry analyst forecasts reveal that the company's earnings growth is expected to slow down. To know more about the company's future earnings growth forecasts take a look at this free report on analyst forecasts for the company to find out more.
New: Manage All Your Stock Portfolios in One Place
We've created the ultimate portfolio companion for stock investors, and it's free.
• Connect an unlimited number of Portfolios and see your total in one currency
• Be alerted to new Warning Signs or Risks via email or mobile
• Track the Fair Value of your stocks
Have feedback on this article? Concerned about the content? Get in touch with us directly. Alternatively, email editorial-team (at) simplywallst.com.
This article by Simply Wall St is general in nature. We provide commentary based on historical data and analyst forecasts only using an unbiased methodology and our articles are not intended to be financial advice. It does not constitute a recommendation to buy or sell any stock, and does not take account of your objectives, or your financial situation. We aim to bring you long-term focused analysis driven by fundamental data. Note that our analysis may not factor in the latest price-sensitive company announcements or qualitative material. Simply Wall St has no position in any stocks mentioned.
About SHSE:688617
APT Medical
Engages in the research and development, production, and sale of cardiovascular interventional medical devices in China.
Exceptional growth potential with flawless balance sheet.
Market Insights

Advertisement
Community Narratives
The company that turned a verb into a global necessity and basically runs the modern internet, digital ads, smartphones, maps, and AI.
Fair Value US$300.00|10.8% undervalued
OS
Community Contributor
Flowers Foods Pays A Fair Price For Health
Fair Value US$16.12|22.0% undervalued
NV
Community Contributor
TMX Group will thrive with 33.3% profit margin and enduring market moat
Fair Value CA$49.90|3.8% overvalued
LI
Community Contributor