Yunnan Energy Investment's (SZSE:002053) five-year earnings growth trails the 12% YoY shareholder returns


When we invest, we're generally looking for stocks that outperform the market average. And the truth is, you can make significant gains if you buy good quality businesses at the right price. For example, long term Yunnan Energy Investment Co., Ltd. (SZSE:002053) shareholders have enjoyed a 76% share price rise over the last half decade, well in excess of the market return of around 13% (not including dividends). On the other hand, the more recent gains haven't been so impressive, with shareholders gaining just 27%, including dividends.
The past week has proven to be lucrative for Yunnan Energy Investment investors, so let's see if fundamentals drove the company's five-year performance.
See our latest analysis for Yunnan Energy Investment
While markets are a powerful pricing mechanism, share prices reflect investor sentiment, not just underlying business performance. By comparing earnings per share (EPS) and share price changes over time, we can get a feel for how investor attitudes to a company have morphed over time.
During five years of share price growth, Yunnan Energy Investment achieved compound earnings per share (EPS) growth of 15% per year. The EPS growth is more impressive than the yearly share price gain of 12% over the same period. Therefore, it seems the market has become relatively pessimistic about the company.
You can see how EPS has changed over time in the image below (click on the chart to see the exact values).
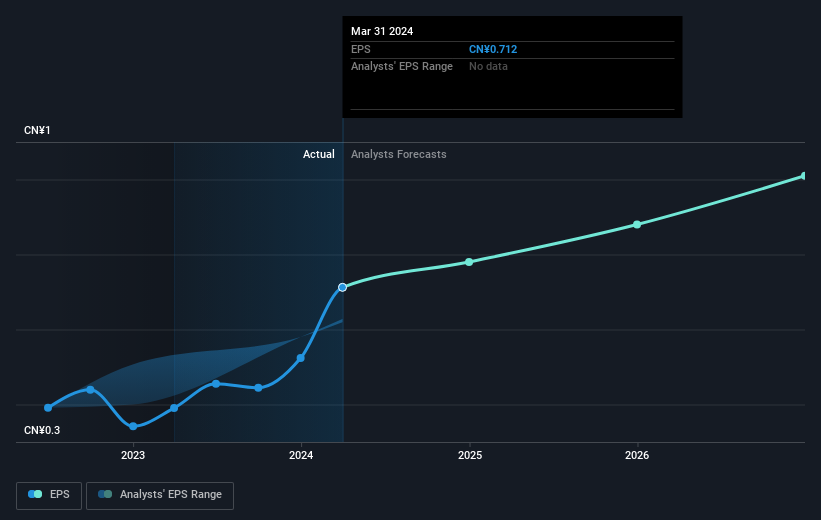
It is of course excellent to see how Yunnan Energy Investment has grown profits over the years, but the future is more important for shareholders. It might be well worthwhile taking a look at our free report on how its financial position has changed over time.
What About Dividends?
When looking at investment returns, it is important to consider the difference between total shareholder return (TSR) and share price return. The TSR is a return calculation that accounts for the value of cash dividends (assuming that any dividend received was reinvested) and the calculated value of any discounted capital raisings and spin-offs. Arguably, the TSR gives a more comprehensive picture of the return generated by a stock. As it happens, Yunnan Energy Investment's TSR for the last 5 years was 80%, which exceeds the share price return mentioned earlier. And there's no prize for guessing that the dividend payments largely explain the divergence!
A Different Perspective
It's nice to see that Yunnan Energy Investment shareholders have received a total shareholder return of 27% over the last year. Of course, that includes the dividend. That's better than the annualised return of 12% over half a decade, implying that the company is doing better recently. Given the share price momentum remains strong, it might be worth taking a closer look at the stock, lest you miss an opportunity. I find it very interesting to look at share price over the long term as a proxy for business performance. But to truly gain insight, we need to consider other information, too. Even so, be aware that Yunnan Energy Investment is showing 3 warning signs in our investment analysis , and 2 of those don't sit too well with us...
For those who like to find winning investments this free list of undervalued companies with recent insider purchasing, could be just the ticket.
Please note, the market returns quoted in this article reflect the market weighted average returns of stocks that currently trade on Chinese exchanges.
New: Manage All Your Stock Portfolios in One Place
We've created the ultimate portfolio companion for stock investors, and it's free.
• Connect an unlimited number of Portfolios and see your total in one currency
• Be alerted to new Warning Signs or Risks via email or mobile
• Track the Fair Value of your stocks
Have feedback on this article? Concerned about the content? Get in touch with us directly. Alternatively, email editorial-team (at) simplywallst.com.
This article by Simply Wall St is general in nature. We provide commentary based on historical data and analyst forecasts only using an unbiased methodology and our articles are not intended to be financial advice. It does not constitute a recommendation to buy or sell any stock, and does not take account of your objectives, or your financial situation. We aim to bring you long-term focused analysis driven by fundamental data. Note that our analysis may not factor in the latest price-sensitive company announcements or qualitative material. Simply Wall St has no position in any stocks mentioned.
About SZSE:002053
Yunnan Energy Investment
Manufactures and sells various salt products in China.
Proven track record and fair value.
