Fujian Tianma Science and Technology Group (SHSE:603668) shareholder returns have been decent, earning 83% in 3 years


By buying an index fund, investors can approximate the average market return. But if you buy good businesses at attractive prices, your portfolio returns could exceed the average market return. For example, the Fujian Tianma Science and Technology Group Co., Ltd (SHSE:603668) share price is up 82% in the last three years, clearly besting the market decline of around 30% (not including dividends).
The past week has proven to be lucrative for Fujian Tianma Science and Technology Group investors, so let's see if fundamentals drove the company's three-year performance.
View our latest analysis for Fujian Tianma Science and Technology Group
To quote Buffett, 'Ships will sail around the world but the Flat Earth Society will flourish. There will continue to be wide discrepancies between price and value in the marketplace...' One flawed but reasonable way to assess how sentiment around a company has changed is to compare the earnings per share (EPS) with the share price.
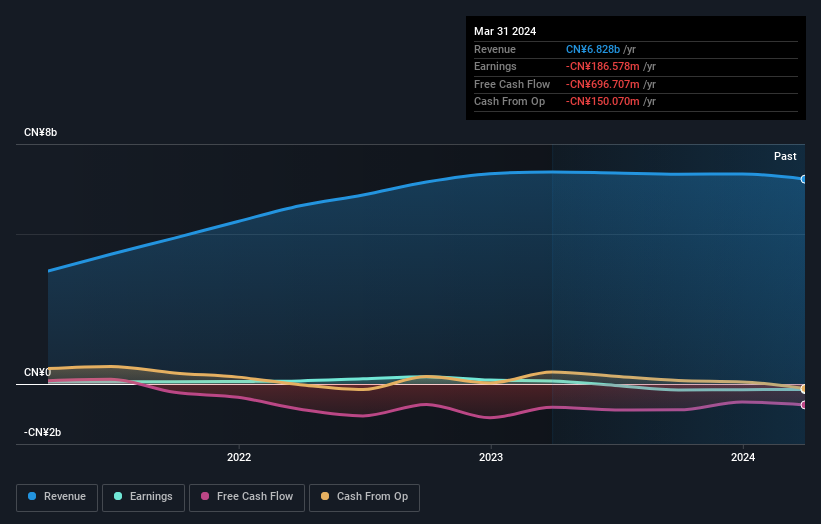
Over the last three years, Fujian Tianma Science and Technology Group failed to grow earnings per share, which fell 77% (annualized).
This means it's unlikely the market is judging the company based on earnings growth. Since the change in EPS doesn't seem to correlate with the change in share price, it's worth taking a look at other metrics.
It may well be that Fujian Tianma Science and Technology Group revenue growth rate of 17% over three years has convinced shareholders to believe in a brighter future. In that case, the company may be sacrificing current earnings per share to drive growth, and maybe shareholder's faith in better days ahead will be rewarded.
You can see below how earnings and revenue have changed over time (discover the exact values by clicking on the image).
If you are thinking of buying or selling Fujian Tianma Science and Technology Group stock, you should check out this FREE detailed report on its balance sheet.
A Different Perspective
Although it hurts that Fujian Tianma Science and Technology Group returned a loss of 12% in the last twelve months, the broader market was actually worse, returning a loss of 17%. Longer term investors wouldn't be so upset, since they would have made 10%, each year, over five years. In the best case scenario the last year is just a temporary blip on the journey to a brighter future. I find it very interesting to look at share price over the long term as a proxy for business performance. But to truly gain insight, we need to consider other information, too. To that end, you should learn about the 3 warning signs we've spotted with Fujian Tianma Science and Technology Group (including 2 which are concerning) .
If you would prefer to check out another company -- one with potentially superior financials -- then do not miss this free list of companies that have proven they can grow earnings.
Please note, the market returns quoted in this article reflect the market weighted average returns of stocks that currently trade on Chinese exchanges.
New: AI Stock Screener & Alerts
Our new AI Stock Screener scans the market every day to uncover opportunities.
• Dividend Powerhouses (3%+ Yield)
• Undervalued Small Caps with Insider Buying
• High growth Tech and AI Companies
Or build your own from over 50 metrics.
Have feedback on this article? Concerned about the content? Get in touch with us directly. Alternatively, email editorial-team (at) simplywallst.com.
This article by Simply Wall St is general in nature. We provide commentary based on historical data and analyst forecasts only using an unbiased methodology and our articles are not intended to be financial advice. It does not constitute a recommendation to buy or sell any stock, and does not take account of your objectives, or your financial situation. We aim to bring you long-term focused analysis driven by fundamental data. Note that our analysis may not factor in the latest price-sensitive company announcements or qualitative material. Simply Wall St has no position in any stocks mentioned.
Have feedback on this article? Concerned about the content? Get in touch with us directly. Alternatively, email editorial-team@simplywallst.com
About SHSE:603668
Fujian Tianma Science and Technology Group
Fujian Tianma Science and Technology Group Co., Ltd.
Low and slightly overvalued.
