
Advertisement
Is There An Opportunity With Sichuan Teway Food Group Co.,Ltd's (SHSE:603317) 39% Undervaluation?

Key Insights
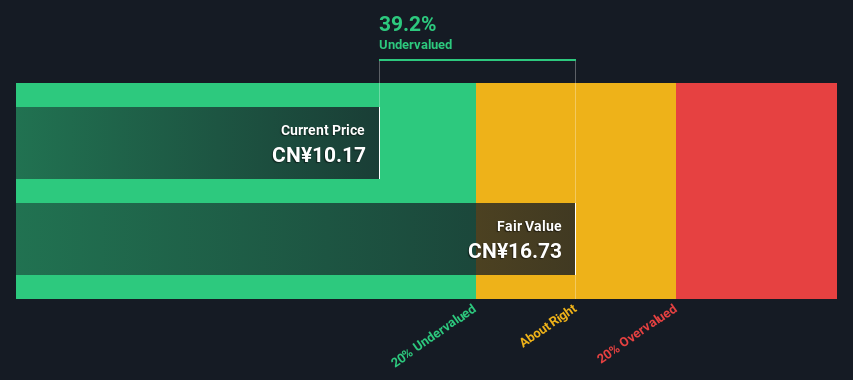
- The projected fair value for Sichuan Teway Food GroupLtd is CN¥16.73 based on 2 Stage Free Cash Flow to Equity
- Sichuan Teway Food GroupLtd is estimated to be 39% undervalued based on current share price of CN¥10.17
- Analyst price target for 603317 is CN¥14.93 which is 11% below our fair value estimate
Today we'll do a simple run through of a valuation method used to estimate the attractiveness of Sichuan Teway Food Group Co.,Ltd (SHSE:603317) as an investment opportunity by projecting its future cash flows and then discounting them to today's value. Our analysis will employ the Discounted Cash Flow (DCF) model. Believe it or not, it's not too difficult to follow, as you'll see from our example!
Remember though, that there are many ways to estimate a company's value, and a DCF is just one method. For those who are keen learners of equity analysis, the Simply Wall St analysis model here may be something of interest to you.
Check out our latest analysis for Sichuan Teway Food GroupLtd
The Model
We are going to use a two-stage DCF model, which, as the name states, takes into account two stages of growth. The first stage is generally a higher growth period which levels off heading towards the terminal value, captured in the second 'steady growth' period. To begin with, we have to get estimates of the next ten years of cash flows. Where possible we use analyst estimates, but when these aren't available we extrapolate the previous free cash flow (FCF) from the last estimate or reported value. We assume companies with shrinking free cash flow will slow their rate of shrinkage, and that companies with growing free cash flow will see their growth rate slow, over this period. We do this to reflect that growth tends to slow more in the early years than it does in later years.
A DCF is all about the idea that a dollar in the future is less valuable than a dollar today, and so the sum of these future cash flows is then discounted to today's value:
10-year free cash flow (FCF) forecast
| 2025 | 2026 | 2027 | 2028 | 2029 | 2030 | 2031 | 2032 | 2033 | 2034 | |
| Levered FCF (CN¥, Millions) | CN¥560.6m | CN¥658.1m | CN¥731.7m | CN¥795.3m | CN¥850.6m | CN¥899.5m | CN¥943.4m | CN¥983.9m | CN¥1.02b | CN¥1.06b |
| Growth Rate Estimate Source | Analyst x2 | Analyst x2 | Est @ 11.18% | Est @ 8.69% | Est @ 6.96% | Est @ 5.74% | Est @ 4.89% | Est @ 4.29% | Est @ 3.87% | Est @ 3.58% |
| Present Value (CN¥, Millions) Discounted @ 7.4% | CN¥522 | CN¥571 | CN¥591 | CN¥598 | CN¥595 | CN¥586 | CN¥572 | CN¥556 | CN¥537 | CN¥518 |
("Est" = FCF growth rate estimated by Simply Wall St)
Present Value of 10-year Cash Flow (PVCF) = CN¥5.6b
We now need to calculate the Terminal Value, which accounts for all the future cash flows after this ten year period. For a number of reasons a very conservative growth rate is used that cannot exceed that of a country's GDP growth. In this case we have used the 5-year average of the 10-year government bond yield (2.9%) to estimate future growth. In the same way as with the 10-year 'growth' period, we discount future cash flows to today's value, using a cost of equity of 7.4%.
Terminal Value (TV)= FCF2034 × (1 + g) ÷ (r – g) = CN¥1.1b× (1 + 2.9%) ÷ (7.4%– 2.9%) = CN¥24b
Present Value of Terminal Value (PVTV)= TV / (1 + r)10= CN¥24b÷ ( 1 + 7.4%)10= CN¥12b
The total value, or equity value, is then the sum of the present value of the future cash flows, which in this case is CN¥17b. To get the intrinsic value per share, we divide this by the total number of shares outstanding. Compared to the current share price of CN¥10.2, the company appears quite undervalued at a 39% discount to where the stock price trades currently. Remember though, that this is just an approximate valuation, and like any complex formula - garbage in, garbage out.
The Assumptions
Now the most important inputs to a discounted cash flow are the discount rate, and of course, the actual cash flows. If you don't agree with these result, have a go at the calculation yourself and play with the assumptions. The DCF also does not consider the possible cyclicality of an industry, or a company's future capital requirements, so it does not give a full picture of a company's potential performance. Given that we are looking at Sichuan Teway Food GroupLtd as potential shareholders, the cost of equity is used as the discount rate, rather than the cost of capital (or weighted average cost of capital, WACC) which accounts for debt. In this calculation we've used 7.4%, which is based on a levered beta of 0.800. Beta is a measure of a stock's volatility, compared to the market as a whole. We get our beta from the industry average beta of globally comparable companies, with an imposed limit between 0.8 and 2.0, which is a reasonable range for a stable business.
SWOT Analysis for Sichuan Teway Food GroupLtd
Strength
- Earnings growth over the past year exceeded the industry.
- Currently debt free.
- Dividends are covered by earnings and cash flows.
- Dividend is in the top 25% of dividend payers in the market.
Weakness
- No major weaknesses identified for 603317.
Opportunity
- Annual earnings are forecast to grow for the next 3 years.
- Trading below our estimate of fair value by more than 20%.
Threat
- Annual earnings are forecast to grow slower than the Chinese market.
Next Steps:
Valuation is only one side of the coin in terms of building your investment thesis, and it ideally won't be the sole piece of analysis you scrutinize for a company. It's not possible to obtain a foolproof valuation with a DCF model. Instead the best use for a DCF model is to test certain assumptions and theories to see if they would lead to the company being undervalued or overvalued. For instance, if the terminal value growth rate is adjusted slightly, it can dramatically alter the overall result. What is the reason for the share price sitting below the intrinsic value? For Sichuan Teway Food GroupLtd, we've compiled three further aspects you should explore:
- Risks: To that end, you should be aware of the 1 warning sign we've spotted with Sichuan Teway Food GroupLtd .
- Future Earnings: How does 603317's growth rate compare to its peers and the wider market? Dig deeper into the analyst consensus number for the upcoming years by interacting with our free analyst growth expectation chart.
- Other High Quality Alternatives: Do you like a good all-rounder? Explore our interactive list of high quality stocks to get an idea of what else is out there you may be missing!
PS. The Simply Wall St app conducts a discounted cash flow valuation for every stock on the SHSE every day. If you want to find the calculation for other stocks just search here.
New: Manage All Your Stock Portfolios in One Place
We've created the ultimate portfolio companion for stock investors, and it's free.
• Connect an unlimited number of Portfolios and see your total in one currency
• Be alerted to new Warning Signs or Risks via email or mobile
• Track the Fair Value of your stocks
Have feedback on this article? Concerned about the content? Get in touch with us directly. Alternatively, email editorial-team (at) simplywallst.com.
This article by Simply Wall St is general in nature. We provide commentary based on historical data and analyst forecasts only using an unbiased methodology and our articles are not intended to be financial advice. It does not constitute a recommendation to buy or sell any stock, and does not take account of your objectives, or your financial situation. We aim to bring you long-term focused analysis driven by fundamental data. Note that our analysis may not factor in the latest price-sensitive company announcements or qualitative material. Simply Wall St has no position in any stocks mentioned.
Have feedback on this article? Concerned about the content? Get in touch with us directly. Alternatively, email editorial-team@simplywallst.com
About SHSE:603317
Sichuan Teway Food GroupLtd
Engages in the research, development, production, and sale of compound seasonings in China.
Flawless balance sheet and good value.
Market Insights


Advertisement
Community Narratives
Alphabet: The Under-appreciated Compounder Hiding in Plain Sight
Fair Value US$268.43|27.9% undervalued
BL
Community Contributor
Planet Labs: At The Heart Of The Emerging New Space Boom
Fair Value US$11.31|43.8% undervalued
AN
Community Contributor
Exxon in Guyana 5 year forecast Low $135 to High $189
Fair Value US$189.00|41.0% undervalued
AG
Community Contributor