
Advertisement
- China
- /
- Energy Services
- /
- SZSE:300157
Some New JCM Group Co.,Ltd (SZSE:300157) Shareholders Look For Exit As Shares Take 28% Pounding
Unfortunately for some shareholders, the New JCM Group Co.,Ltd (SZSE:300157) share price has dived 28% in the last thirty days, prolonging recent pain. The drop over the last 30 days has capped off a tough year for shareholders, with the share price down 43% in that time.
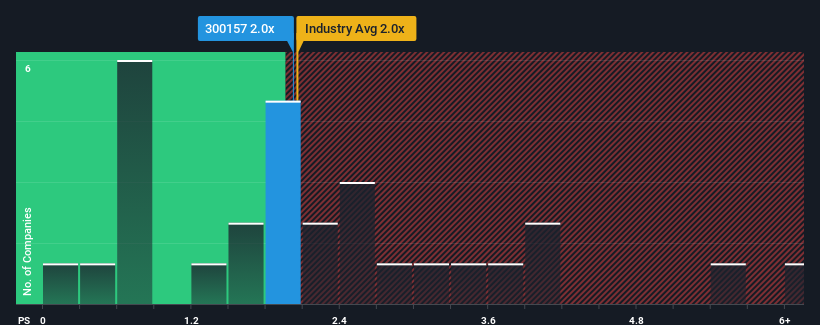
In spite of the heavy fall in price, you could still be forgiven for feeling indifferent about New JCM GroupLtd's P/S ratio of 2x, since the median price-to-sales (or "P/S") ratio for the Energy Services industry in China is about the same. While this might not raise any eyebrows, if the P/S ratio is not justified investors could be missing out on a potential opportunity or ignoring looming disappointment.
See our latest analysis for New JCM GroupLtd
How Has New JCM GroupLtd Performed Recently?
New JCM GroupLtd has been doing a good job lately as it's been growing revenue at a solid pace. One possibility is that the P/S is moderate because investors think this respectable revenue growth might not be enough to outperform the broader industry in the near future. If that doesn't eventuate, then existing shareholders probably aren't too pessimistic about the future direction of the share price.
We don't have analyst forecasts, but you can see how recent trends are setting up the company for the future by checking out our free report on New JCM GroupLtd's earnings, revenue and cash flow.Is There Some Revenue Growth Forecasted For New JCM GroupLtd?
There's an inherent assumption that a company should be matching the industry for P/S ratios like New JCM GroupLtd's to be considered reasonable.
Taking a look back first, we see that the company managed to grow revenues by a handy 7.6% last year. Still, lamentably revenue has fallen 10.0% in aggregate from three years ago, which is disappointing. So unfortunately, we have to acknowledge that the company has not done a great job of growing revenue over that time.
In contrast to the company, the rest of the industry is expected to grow by 17% over the next year, which really puts the company's recent medium-term revenue decline into perspective.
With this information, we find it concerning that New JCM GroupLtd is trading at a fairly similar P/S compared to the industry. It seems most investors are ignoring the recent poor growth rate and are hoping for a turnaround in the company's business prospects. There's a good chance existing shareholders are setting themselves up for future disappointment if the P/S falls to levels more in line with the recent negative growth rates.
The Bottom Line On New JCM GroupLtd's P/S
With its share price dropping off a cliff, the P/S for New JCM GroupLtd looks to be in line with the rest of the Energy Services industry. Using the price-to-sales ratio alone to determine if you should sell your stock isn't sensible, however it can be a practical guide to the company's future prospects.
The fact that New JCM GroupLtd currently trades at a P/S on par with the rest of the industry is surprising to us since its recent revenues have been in decline over the medium-term, all while the industry is set to grow. Even though it matches the industry, we're uncomfortable with the current P/S ratio, as this dismal revenue performance is unlikely to support a more positive sentiment for long. Unless the recent medium-term conditions improve markedly, investors will have a hard time accepting the share price as fair value.
Before you take the next step, you should know about the 1 warning sign for New JCM GroupLtd that we have uncovered.
If you're unsure about the strength of New JCM GroupLtd's business, why not explore our interactive list of stocks with solid business fundamentals for some other companies you may have missed.
Valuation is complex, but we're here to simplify it.
Discover if New JCM GroupLtd might be undervalued or overvalued with our detailed analysis, featuring fair value estimates, potential risks, dividends, insider trades, and its financial condition.
Access Free AnalysisHave feedback on this article? Concerned about the content? Get in touch with us directly. Alternatively, email editorial-team (at) simplywallst.com.
This article by Simply Wall St is general in nature. We provide commentary based on historical data and analyst forecasts only using an unbiased methodology and our articles are not intended to be financial advice. It does not constitute a recommendation to buy or sell any stock, and does not take account of your objectives, or your financial situation. We aim to bring you long-term focused analysis driven by fundamental data. Note that our analysis may not factor in the latest price-sensitive company announcements or qualitative material. Simply Wall St has no position in any stocks mentioned.
About SZSE:300157
New JCM GroupLtd
Engages in equipment manufacturing business in China and internationally.
Mediocre balance sheet with weak fundamentals.
Market Insights

Advertisement
Community Narratives
Finding The True Value Of A Logistics Powerhouse
Fair Value US$95.21|8.4% undervalued
NV
Community Contributor
Paradigm Biopharmaceuticals Will Lead Osteoarthritis Treatment with Zilosul's FDA Success
Fair Value AU$5.50|92.1% undervalued
AM
Community Contributor
Barrick Mining (ABX:CA): A Gold Hedge against a U.S. Shutdown
Fair Value CA$60.00|24.2% undervalued
GM
Community Contributor