- China
- /
- Oil and Gas
- /
- SZSE:002221
Investors in Oriental Energy (SZSE:002221) have unfortunately lost 24% over the last three years


These days it's easy to simply buy an index fund, and your returns should (roughly) match the market. But in any given year a good portion of stocks will fall short of that. Unfortunately for investors in Oriental Energy Co., Ltd. (SZSE:002221), the share price has slipped 27% in three years, falling short of the marketdecline of 23%.
With that in mind, it's worth seeing if the company's underlying fundamentals have been the driver of long term performance, or if there are some discrepancies.
Check out our latest analysis for Oriental Energy
To paraphrase Benjamin Graham: Over the short term the market is a voting machine, but over the long term it's a weighing machine. By comparing earnings per share (EPS) and share price changes over time, we can get a feel for how investor attitudes to a company have morphed over time.
During five years of share price growth, Oriental Energy moved from a loss to profitability. That would generally be considered a positive, so we are surprised to see the share price is down. So it's worth looking at other metrics to try to understand the share price move.
With revenue flat over three years, it seems unlikely that the share price is reflecting the top line. We're not entirely sure why the share price is dropped, but it does seem likely investors have become less optimistic about the business.
The company's revenue and earnings (over time) are depicted in the image below (click to see the exact numbers).
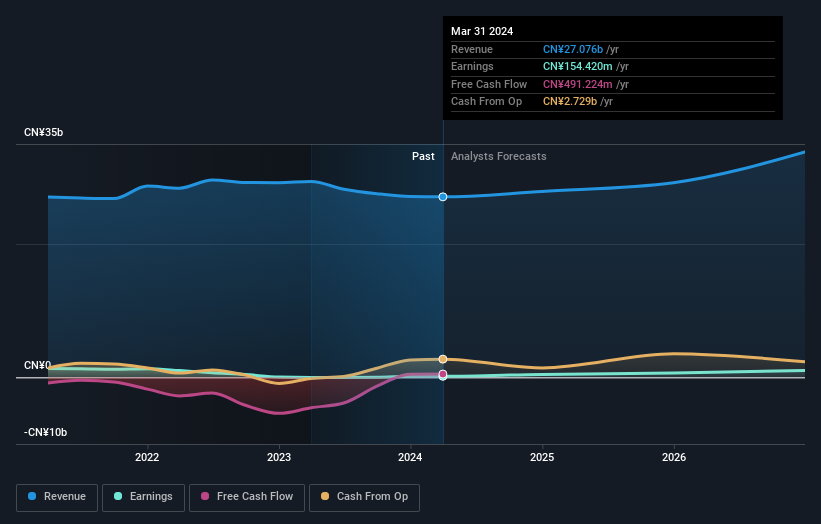
We're pleased to report that the CEO is remunerated more modestly than most CEOs at similarly capitalized companies. But while CEO remuneration is always worth checking, the really important question is whether the company can grow earnings going forward. You can see what analysts are predicting for Oriental Energy in this interactive graph of future profit estimates.
What About The Total Shareholder Return (TSR)?
We'd be remiss not to mention the difference between Oriental Energy's total shareholder return (TSR) and its share price return. The TSR is a return calculation that accounts for the value of cash dividends (assuming that any dividend received was reinvested) and the calculated value of any discounted capital raisings and spin-offs. Oriental Energy's TSR of was a loss of 24% for the 3 years. That wasn't as bad as its share price return, because it has paid dividends.
A Different Perspective
It's good to see that Oriental Energy has rewarded shareholders with a total shareholder return of 6.4% in the last twelve months. That gain is better than the annual TSR over five years, which is 1.6%. Therefore it seems like sentiment around the company has been positive lately. Someone with an optimistic perspective could view the recent improvement in TSR as indicating that the business itself is getting better with time. I find it very interesting to look at share price over the long term as a proxy for business performance. But to truly gain insight, we need to consider other information, too. To that end, you should learn about the 2 warning signs we've spotted with Oriental Energy (including 1 which is significant) .
For those who like to find winning investments this free list of undervalued companies with recent insider purchasing, could be just the ticket.
Please note, the market returns quoted in this article reflect the market weighted average returns of stocks that currently trade on Chinese exchanges.
New: AI Stock Screener & Alerts
Our new AI Stock Screener scans the market every day to uncover opportunities.
• Dividend Powerhouses (3%+ Yield)
• Undervalued Small Caps with Insider Buying
• High growth Tech and AI Companies
Or build your own from over 50 metrics.
Have feedback on this article? Concerned about the content? Get in touch with us directly. Alternatively, email editorial-team (at) simplywallst.com.
This article by Simply Wall St is general in nature. We provide commentary based on historical data and analyst forecasts only using an unbiased methodology and our articles are not intended to be financial advice. It does not constitute a recommendation to buy or sell any stock, and does not take account of your objectives, or your financial situation. We aim to bring you long-term focused analysis driven by fundamental data. Note that our analysis may not factor in the latest price-sensitive company announcements or qualitative material. Simply Wall St has no position in any stocks mentioned.
About SZSE:002221
Oriental Energy
Engages in the production and sale of low-temperature and atmospheric pressure liquefied petroleum gas, propylene, polypropylene, and other chemical products in China.
Moderate growth potential with mediocre balance sheet.
