
Advertisement
- China
- /
- Hospitality
- /
- SZSE:301073
Revenues Tell The Story For SSAW Hotels & Resorts Group Co.,Ltd. (SZSE:301073) As Its Stock Soars 27%

Those holding SSAW Hotels & Resorts Group Co.,Ltd. (SZSE:301073) shares would be relieved that the share price has rebounded 27% in the last thirty days, but it needs to keep going to repair the recent damage it has caused to investor portfolios. Still, the 30-day jump doesn't change the fact that longer term shareholders have seen their stock decimated by the 62% share price drop in the last twelve months.
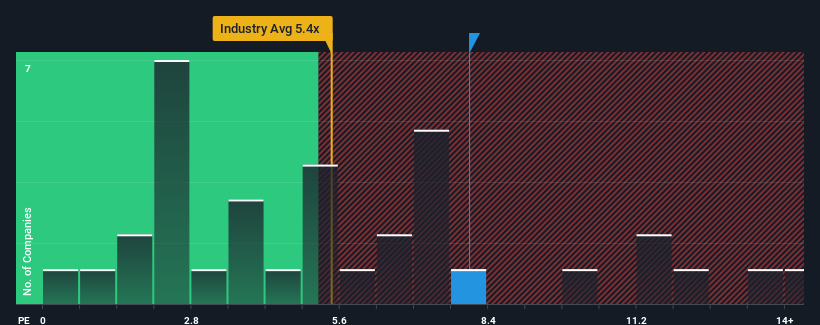
Following the firm bounce in price, SSAW Hotels & Resorts GroupLtd may be sending bearish signals at the moment with its price-to-sales (or "P/S") ratio of 8x, since almost half of all companies in the Hospitality in China have P/S ratios under 5.4x and even P/S lower than 2x are not unusual. Nonetheless, we'd need to dig a little deeper to determine if there is a rational basis for the elevated P/S.
View our latest analysis for SSAW Hotels & Resorts GroupLtd
What Does SSAW Hotels & Resorts GroupLtd's Recent Performance Look Like?
SSAW Hotels & Resorts GroupLtd could be doing better as it's been growing revenue less than most other companies lately. It might be that many expect the uninspiring revenue performance to recover significantly, which has kept the P/S ratio from collapsing. If not, then existing shareholders may be very nervous about the viability of the share price.
If you'd like to see what analysts are forecasting going forward, you should check out our free report on SSAW Hotels & Resorts GroupLtd.How Is SSAW Hotels & Resorts GroupLtd's Revenue Growth Trending?
SSAW Hotels & Resorts GroupLtd's P/S ratio would be typical for a company that's expected to deliver solid growth, and importantly, perform better than the industry.
If we review the last year of revenue growth, the company posted a terrific increase of 52%. Pleasingly, revenue has also lifted 79% in aggregate from three years ago, thanks to the last 12 months of growth. So we can start by confirming that the company has done a great job of growing revenue over that time.
Looking ahead now, revenue is anticipated to climb by 65% during the coming year according to the five analysts following the company. Meanwhile, the rest of the industry is forecast to only expand by 39%, which is noticeably less attractive.
In light of this, it's understandable that SSAW Hotels & Resorts GroupLtd's P/S sits above the majority of other companies. It seems most investors are expecting this strong future growth and are willing to pay more for the stock.
What We Can Learn From SSAW Hotels & Resorts GroupLtd's P/S?
The large bounce in SSAW Hotels & Resorts GroupLtd's shares has lifted the company's P/S handsomely. Using the price-to-sales ratio alone to determine if you should sell your stock isn't sensible, however it can be a practical guide to the company's future prospects.
Our look into SSAW Hotels & Resorts GroupLtd shows that its P/S ratio remains high on the merit of its strong future revenues. Right now shareholders are comfortable with the P/S as they are quite confident future revenues aren't under threat. Unless these conditions change, they will continue to provide strong support to the share price.
Don't forget that there may be other risks. For instance, we've identified 3 warning signs for SSAW Hotels & Resorts GroupLtd that you should be aware of.
Of course, profitable companies with a history of great earnings growth are generally safer bets. So you may wish to see this free collection of other companies that have reasonable P/E ratios and have grown earnings strongly.
New: Manage All Your Stock Portfolios in One Place
We've created the ultimate portfolio companion for stock investors, and it's free.
• Connect an unlimited number of Portfolios and see your total in one currency
• Be alerted to new Warning Signs or Risks via email or mobile
• Track the Fair Value of your stocks
Have feedback on this article? Concerned about the content? Get in touch with us directly. Alternatively, email editorial-team (at) simplywallst.com.
This article by Simply Wall St is general in nature. We provide commentary based on historical data and analyst forecasts only using an unbiased methodology and our articles are not intended to be financial advice. It does not constitute a recommendation to buy or sell any stock, and does not take account of your objectives, or your financial situation. We aim to bring you long-term focused analysis driven by fundamental data. Note that our analysis may not factor in the latest price-sensitive company announcements or qualitative material. Simply Wall St has no position in any stocks mentioned.
About SZSE:301073
Excellent balance sheet with moderate growth potential.
Market Insights


Advertisement
Community Narratives
Alphabet: The Under-appreciated Compounder Hiding in Plain Sight
Fair Value US$268.43|26.8% undervalued
BL
Community Contributor
Planet Labs: At The Heart Of The Emerging New Space Boom
Fair Value US$11.31|45.3% undervalued
AN
Community Contributor
Exxon in Guyana 5 year forecast Low $135 to High $189
Fair Value US$189.00|40.3% undervalued
AG
Community Contributor