
Advertisement
- China
- /
- Food and Staples Retail
- /
- SZSE:000759
Zhongbai Holdings Group Co.,Ltd. (SZSE:000759) Surges 29% Yet Its Low P/S Is No Reason For Excitement
Zhongbai Holdings Group Co.,Ltd. (SZSE:000759) shareholders are no doubt pleased to see that the share price has bounced 29% in the last month, although it is still struggling to make up recently lost ground. Unfortunately, the gains of the last month did little to right the losses of the last year with the stock still down 20% over that time.
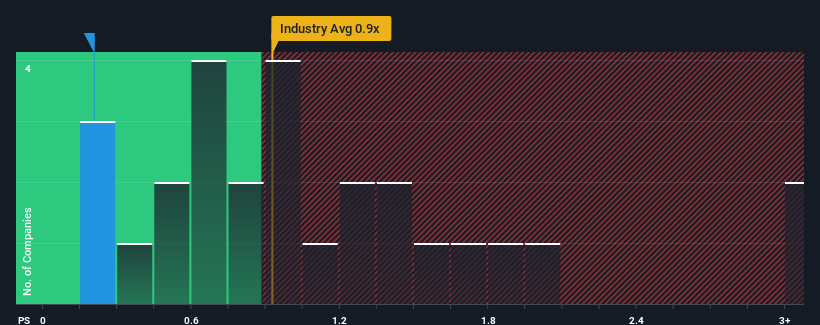
Although its price has surged higher, it would still be understandable if you think Zhongbai Holdings GroupLtd is a stock with good investment prospects with a price-to-sales ratios (or "P/S") of 0.2x, considering almost half the companies in China's Consumer Retailing industry have P/S ratios above 0.9x. However, the P/S might be low for a reason and it requires further investigation to determine if it's justified.
View our latest analysis for Zhongbai Holdings GroupLtd
How Zhongbai Holdings GroupLtd Has Been Performing
Zhongbai Holdings GroupLtd hasn't been tracking well recently as its declining revenue compares poorly to other companies, which have seen some growth in their revenues on average. The P/S ratio is probably low because investors think this poor revenue performance isn't going to get any better. If you still like the company, you'd be hoping this isn't the case so that you could potentially pick up some stock while it's out of favour.
Want the full picture on analyst estimates for the company? Then our free report on Zhongbai Holdings GroupLtd will help you uncover what's on the horizon.What Are Revenue Growth Metrics Telling Us About The Low P/S?
There's an inherent assumption that a company should underperform the industry for P/S ratios like Zhongbai Holdings GroupLtd's to be considered reasonable.
Taking a look back first, we see that there was hardly any revenue growth to speak of for the company over the past year. Whilst it's an improvement, it wasn't enough to get the company out of the hole it was in, with revenue down 13% overall from three years ago. So unfortunately, we have to acknowledge that the company has not done a great job of growing revenue over that time.
Looking ahead now, revenue is anticipated to climb by 3.9% during the coming year according to the two analysts following the company. That's shaping up to be materially lower than the 16% growth forecast for the broader industry.
In light of this, it's understandable that Zhongbai Holdings GroupLtd's P/S sits below the majority of other companies. Apparently many shareholders weren't comfortable holding on while the company is potentially eyeing a less prosperous future.
What Does Zhongbai Holdings GroupLtd's P/S Mean For Investors?
The latest share price surge wasn't enough to lift Zhongbai Holdings GroupLtd's P/S close to the industry median. We'd say the price-to-sales ratio's power isn't primarily as a valuation instrument but rather to gauge current investor sentiment and future expectations.
As expected, our analysis of Zhongbai Holdings GroupLtd's analyst forecasts confirms that the company's underwhelming revenue outlook is a major contributor to its low P/S. Right now shareholders are accepting the low P/S as they concede future revenue probably won't provide any pleasant surprises. The company will need a change of fortune to justify the P/S rising higher in the future.
Many other vital risk factors can be found on the company's balance sheet. Our free balance sheet analysis for Zhongbai Holdings GroupLtd with six simple checks will allow you to discover any risks that could be an issue.
If strong companies turning a profit tickle your fancy, then you'll want to check out this free list of interesting companies that trade on a low P/E (but have proven they can grow earnings).
Valuation is complex, but we're here to simplify it.
Discover if Zhongbai Holdings GroupLtd might be undervalued or overvalued with our detailed analysis, featuring fair value estimates, potential risks, dividends, insider trades, and its financial condition.
Access Free AnalysisHave feedback on this article? Concerned about the content? Get in touch with us directly. Alternatively, email editorial-team (at) simplywallst.com.
This article by Simply Wall St is general in nature. We provide commentary based on historical data and analyst forecasts only using an unbiased methodology and our articles are not intended to be financial advice. It does not constitute a recommendation to buy or sell any stock, and does not take account of your objectives, or your financial situation. We aim to bring you long-term focused analysis driven by fundamental data. Note that our analysis may not factor in the latest price-sensitive company announcements or qualitative material. Simply Wall St has no position in any stocks mentioned.
About SZSE:000759
Mediocre balance sheet and slightly overvalued.
Market Insights

Advertisement
Community Narratives
MINISO's fair value is projected at 26.69 with an anticipated PE ratio shift of 20x
Fair Value US$24.03|11.0% undervalued
BE
Community Contributor
Procter & Gamble: A Dividend Giant Facing Slowing Growth
Fair Value US$119.81|23.3% overvalued
AN
Community Contributor
Eli Lilly's Future Growth Driven by Tirzepatide and Favorable Market Conditions
Fair Value US$1.19k|13.8% undervalued
EA
Community Contributor