
Advertisement
BIEM.L.FDLKK Garment Co.,Ltd.'s (SZSE:002832) Shares Leap 36% Yet They're Still Not Telling The Full Story
BIEM.L.FDLKK Garment Co.,Ltd. (SZSE:002832) shares have had a really impressive month, gaining 36% after a shaky period beforehand. Not all shareholders will be feeling jubilant, since the share price is still down a very disappointing 28% in the last twelve months.
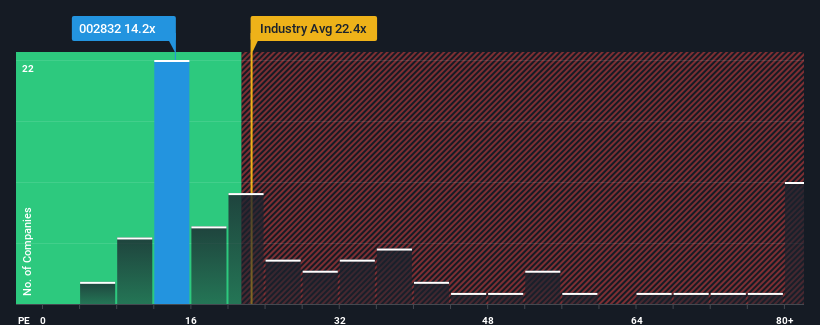
In spite of the firm bounce in price, BIEM.L.FDLKK GarmentLtd may still be sending very bullish signals at the moment with its price-to-earnings (or "P/E") ratio of 14.2x, since almost half of all companies in China have P/E ratios greater than 34x and even P/E's higher than 65x are not unusual. Nonetheless, we'd need to dig a little deeper to determine if there is a rational basis for the highly reduced P/E.
With its earnings growth in positive territory compared to the declining earnings of most other companies, BIEM.L.FDLKK GarmentLtd has been doing quite well of late. One possibility is that the P/E is low because investors think the company's earnings are going to fall away like everyone else's soon. If not, then existing shareholders have reason to be quite optimistic about the future direction of the share price.
View our latest analysis for BIEM.L.FDLKK GarmentLtd
Does Growth Match The Low P/E?
There's an inherent assumption that a company should far underperform the market for P/E ratios like BIEM.L.FDLKK GarmentLtd's to be considered reasonable.
Retrospectively, the last year delivered a decent 15% gain to the company's bottom line. Pleasingly, EPS has also lifted 56% in aggregate from three years ago, partly thanks to the last 12 months of growth. Therefore, it's fair to say the earnings growth recently has been superb for the company.
Turning to the outlook, the next three years should generate growth of 18% per annum as estimated by the four analysts watching the company. With the market predicted to deliver 19% growth per annum, the company is positioned for a comparable earnings result.
With this information, we find it odd that BIEM.L.FDLKK GarmentLtd is trading at a P/E lower than the market. Apparently some shareholders are doubtful of the forecasts and have been accepting lower selling prices.
What We Can Learn From BIEM.L.FDLKK GarmentLtd's P/E?
Shares in BIEM.L.FDLKK GarmentLtd are going to need a lot more upward momentum to get the company's P/E out of its slump. While the price-to-earnings ratio shouldn't be the defining factor in whether you buy a stock or not, it's quite a capable barometer of earnings expectations.
Our examination of BIEM.L.FDLKK GarmentLtd's analyst forecasts revealed that its market-matching earnings outlook isn't contributing to its P/E as much as we would have predicted. There could be some unobserved threats to earnings preventing the P/E ratio from matching the outlook. It appears some are indeed anticipating earnings instability, because these conditions should normally provide more support to the share price.
There are also other vital risk factors to consider before investing and we've discovered 1 warning sign for BIEM.L.FDLKK GarmentLtd that you should be aware of.
You might be able to find a better investment than BIEM.L.FDLKK GarmentLtd. If you want a selection of possible candidates, check out this free list of interesting companies that trade on a low P/E (but have proven they can grow earnings).
Valuation is complex, but we're here to simplify it.
Discover if BIEM.L.FDLKK GarmentLtd might be undervalued or overvalued with our detailed analysis, featuring fair value estimates, potential risks, dividends, insider trades, and its financial condition.
Access Free AnalysisHave feedback on this article? Concerned about the content? Get in touch with us directly. Alternatively, email editorial-team (at) simplywallst.com.
This article by Simply Wall St is general in nature. We provide commentary based on historical data and analyst forecasts only using an unbiased methodology and our articles are not intended to be financial advice. It does not constitute a recommendation to buy or sell any stock, and does not take account of your objectives, or your financial situation. We aim to bring you long-term focused analysis driven by fundamental data. Note that our analysis may not factor in the latest price-sensitive company announcements or qualitative material. Simply Wall St has no position in any stocks mentioned.
About SZSE:002832
BIEM.L.FDLKK GarmentLtd
Engages in the design, development, and sale of apparel products in China.
Very undervalued with flawless balance sheet.
Market Insights

Advertisement
Community Narratives
MicroVision will explode future revenue by 380.37% with a vision towards success
Fair Value US$60|98.4% undervalued
TH
Community Contributor
The Indispensable Artery for a New North American Economy
Fair Value CA$132.87|0.8% undervalued
TI
Community Contributor
Recently Updated Narratives
MA


MarkoVT on COVER ·
Q3 Outlook modestly optimistic
Fair Value:JP¥1.65k2.0% overvalued
1 followerusers have followed this narrative
0 commentsusers have commented on this narrative
0 likesusers have liked this narrative
BL


BlackGoat on Alphabet ·
Alphabet: The Under-appreciated Compounder Hiding in Plain Sight
Fair Value:US$324.481.3% undervalued
80 followersusers have followed this narrative
3 commentsusers have commented on this narrative
1 likeusers have liked this narrative
BE


Bejgal on MINISO Group Holding ·
MINISO's fair value is projected at 26.69 with an anticipated PE ratio shift of 20x
Fair Value:US$26.6926.7% undervalued
46 followersusers have followed this narrative
3 commentsusers have commented on this narrative
0 likesusers have liked this narrative
Popular Narratives
OS

oscargarcia on Alphabet ·
The company that turned a verb into a global necessity and basically runs the modern internet, digital ads, smartphones, maps, and AI.
Fair Value:US$3405.9% undervalued
136 followersusers have followed this narrative
6 commentsusers have commented on this narrative
18 likesusers have liked this narrative
TH

TheWallstreetKing on MicroVision ·
MicroVision will explode future revenue by 380.37% with a vision towards success
Fair Value:US$6098.4% undervalued
91 followersusers have followed this narrative
10 commentsusers have commented on this narrative
18 likesusers have liked this narrative
AN


AnalystConsensusTarget on NVIDIA ·
NVDA: Expanding AI Demand Will Drive Major Data Center Investments Through 2026
Fair Value:US$232.7922.6% undervalued
927 followersusers have followed this narrative
6 commentsusers have commented on this narrative
22 likesusers have liked this narrative