
Advertisement
- China
- /
- Consumer Durables
- /
- SZSE:002681
Shenzhen Fenda Technology Co., Ltd.'s (SZSE:002681) 27% Price Boost Is Out Of Tune With Revenues
Shenzhen Fenda Technology Co., Ltd. (SZSE:002681) shares have had a really impressive month, gaining 27% after a shaky period beforehand. Looking back a bit further, it's encouraging to see the stock is up 86% in the last year.
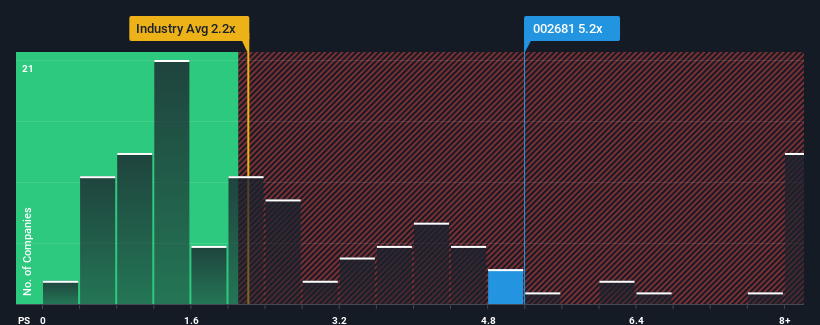
Following the firm bounce in price, when almost half of the companies in China's Consumer Durables industry have price-to-sales ratios (or "P/S") below 2.2x, you may consider Shenzhen Fenda Technology as a stock not worth researching with its 5.2x P/S ratio. Although, it's not wise to just take the P/S at face value as there may be an explanation why it's so lofty.
See our latest analysis for Shenzhen Fenda Technology
What Does Shenzhen Fenda Technology's P/S Mean For Shareholders?
The recent revenue growth at Shenzhen Fenda Technology would have to be considered satisfactory if not spectacular. Perhaps the market believes the recent revenue performance is strong enough to outperform the industry, which has inflated the P/S ratio. If not, then existing shareholders may be a little nervous about the viability of the share price.
Although there are no analyst estimates available for Shenzhen Fenda Technology, take a look at this free data-rich visualisation to see how the company stacks up on earnings, revenue and cash flow.Do Revenue Forecasts Match The High P/S Ratio?
The only time you'd be truly comfortable seeing a P/S as steep as Shenzhen Fenda Technology's is when the company's growth is on track to outshine the industry decidedly.
Taking a look back first, we see that the company managed to grow revenues by a handy 6.1% last year. Ultimately though, it couldn't turn around the poor performance of the prior period, with revenue shrinking 26% in total over the last three years. So unfortunately, we have to acknowledge that the company has not done a great job of growing revenue over that time.
In contrast to the company, the rest of the industry is expected to grow by 10% over the next year, which really puts the company's recent medium-term revenue decline into perspective.
With this information, we find it concerning that Shenzhen Fenda Technology is trading at a P/S higher than the industry. It seems most investors are ignoring the recent poor growth rate and are hoping for a turnaround in the company's business prospects. Only the boldest would assume these prices are sustainable as a continuation of recent revenue trends is likely to weigh heavily on the share price eventually.
The Bottom Line On Shenzhen Fenda Technology's P/S
Shares in Shenzhen Fenda Technology have seen a strong upwards swing lately, which has really helped boost its P/S figure. Using the price-to-sales ratio alone to determine if you should sell your stock isn't sensible, however it can be a practical guide to the company's future prospects.
We've established that Shenzhen Fenda Technology currently trades on a much higher than expected P/S since its recent revenues have been in decline over the medium-term. When we see revenue heading backwards and underperforming the industry forecasts, we feel the possibility of the share price declining is very real, bringing the P/S back into the realm of reasonability. Unless the the circumstances surrounding the recent medium-term improve, it wouldn't be wrong to expect a a difficult period ahead for the company's shareholders.
Before you take the next step, you should know about the 3 warning signs for Shenzhen Fenda Technology (1 is significant!) that we have uncovered.
Of course, profitable companies with a history of great earnings growth are generally safer bets. So you may wish to see this free collection of other companies that have reasonable P/E ratios and have grown earnings strongly.
New: Manage All Your Stock Portfolios in One Place
We've created the ultimate portfolio companion for stock investors, and it's free.
• Connect an unlimited number of Portfolios and see your total in one currency
• Be alerted to new Warning Signs or Risks via email or mobile
• Track the Fair Value of your stocks
Have feedback on this article? Concerned about the content? Get in touch with us directly. Alternatively, email editorial-team (at) simplywallst.com.
This article by Simply Wall St is general in nature. We provide commentary based on historical data and analyst forecasts only using an unbiased methodology and our articles are not intended to be financial advice. It does not constitute a recommendation to buy or sell any stock, and does not take account of your objectives, or your financial situation. We aim to bring you long-term focused analysis driven by fundamental data. Note that our analysis may not factor in the latest price-sensitive company announcements or qualitative material. Simply Wall St has no position in any stocks mentioned.
About SZSE:002681
Shenzhen Fenda Technology
Develops, manufactures, and sells intelligent hardware integrated solutions in China.
Flawless balance sheet and slightly overvalued.
Market Insights

Advertisement
Community Narratives
MINISO's fair value is projected at 26.69 with an anticipated PE ratio shift of 20x
Fair Value US$24.03|11.0% undervalued
BE
Community Contributor
Procter & Gamble: A Dividend Giant Facing Slowing Growth
Fair Value US$119.81|23.3% overvalued
AN
Community Contributor
Eli Lilly's Future Growth Driven by Tirzepatide and Favorable Market Conditions
Fair Value US$1.19k|13.8% undervalued
EA
Community Contributor