
Advertisement
An Intrinsic Calculation For Lancy Co., Ltd. (SZSE:002612) Suggests It's 35% Undervalued
Key Insights
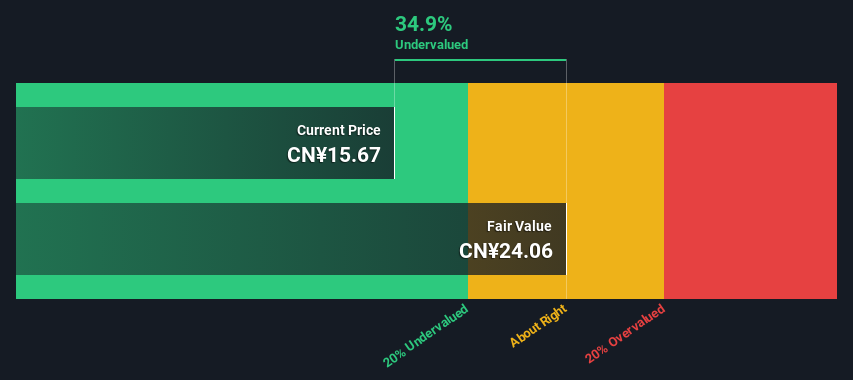
- Lancy's estimated fair value is CN¥24.06 based on 2 Stage Free Cash Flow to Equity
- Lancy's CN¥15.67 share price signals that it might be 35% undervalued
- The CN¥17.50 analyst price target for 002612 is 27% less than our estimate of fair value
How far off is Lancy Co., Ltd. (SZSE:002612) from its intrinsic value? Using the most recent financial data, we'll take a look at whether the stock is fairly priced by taking the expected future cash flows and discounting them to today's value. One way to achieve this is by employing the Discounted Cash Flow (DCF) model. Believe it or not, it's not too difficult to follow, as you'll see from our example!
We generally believe that a company's value is the present value of all of the cash it will generate in the future. However, a DCF is just one valuation metric among many, and it is not without flaws. If you still have some burning questions about this type of valuation, take a look at the Simply Wall St analysis model.
View our latest analysis for Lancy
Crunching The Numbers
We use what is known as a 2-stage model, which simply means we have two different periods of growth rates for the company's cash flows. Generally the first stage is higher growth, and the second stage is a lower growth phase. To start off with, we need to estimate the next ten years of cash flows. Where possible we use analyst estimates, but when these aren't available we extrapolate the previous free cash flow (FCF) from the last estimate or reported value. We assume companies with shrinking free cash flow will slow their rate of shrinkage, and that companies with growing free cash flow will see their growth rate slow, over this period. We do this to reflect that growth tends to slow more in the early years than it does in later years.
Generally we assume that a dollar today is more valuable than a dollar in the future, so we need to discount the sum of these future cash flows to arrive at a present value estimate:
10-year free cash flow (FCF) estimate
| 2025 | 2026 | 2027 | 2028 | 2029 | 2030 | 2031 | 2032 | 2033 | 2034 | |
| Levered FCF (CN¥, Millions) | CN¥450.0m | CN¥642.0m | CN¥683.2m | CN¥719.8m | CN¥752.9m | CN¥783.6m | CN¥812.7m | CN¥840.7m | CN¥868.2m | CN¥895.5m |
| Growth Rate Estimate Source | Analyst x1 | Analyst x1 | Est @ 6.42% | Est @ 5.35% | Est @ 4.60% | Est @ 4.08% | Est @ 3.71% | Est @ 3.45% | Est @ 3.27% | Est @ 3.14% |
| Present Value (CN¥, Millions) Discounted @ 9.2% | CN¥412 | CN¥539 | CN¥525 | CN¥507 | CN¥486 | CN¥463 | CN¥440 | CN¥417 | CN¥395 | CN¥373 |
("Est" = FCF growth rate estimated by Simply Wall St)
Present Value of 10-year Cash Flow (PVCF) = CN¥4.6b
We now need to calculate the Terminal Value, which accounts for all the future cash flows after this ten year period. For a number of reasons a very conservative growth rate is used that cannot exceed that of a country's GDP growth. In this case we have used the 5-year average of the 10-year government bond yield (2.9%) to estimate future growth. In the same way as with the 10-year 'growth' period, we discount future cash flows to today's value, using a cost of equity of 9.2%.
Terminal Value (TV)= FCF2034 × (1 + g) ÷ (r – g) = CN¥896m× (1 + 2.9%) ÷ (9.2%– 2.9%) = CN¥15b
Present Value of Terminal Value (PVTV)= TV / (1 + r)10= CN¥15b÷ ( 1 + 9.2%)10= CN¥6.1b
The total value is the sum of cash flows for the next ten years plus the discounted terminal value, which results in the Total Equity Value, which in this case is CN¥11b. In the final step we divide the equity value by the number of shares outstanding. Relative to the current share price of CN¥15.7, the company appears quite undervalued at a 35% discount to where the stock price trades currently. Remember though, that this is just an approximate valuation, and like any complex formula - garbage in, garbage out.
Important Assumptions
The calculation above is very dependent on two assumptions. The first is the discount rate and the other is the cash flows. You don't have to agree with these inputs, I recommend redoing the calculations yourself and playing with them. The DCF also does not consider the possible cyclicality of an industry, or a company's future capital requirements, so it does not give a full picture of a company's potential performance. Given that we are looking at Lancy as potential shareholders, the cost of equity is used as the discount rate, rather than the cost of capital (or weighted average cost of capital, WACC) which accounts for debt. In this calculation we've used 9.2%, which is based on a levered beta of 1.265. Beta is a measure of a stock's volatility, compared to the market as a whole. We get our beta from the industry average beta of globally comparable companies, with an imposed limit between 0.8 and 2.0, which is a reasonable range for a stable business.
SWOT Analysis for Lancy
Strength
- Earnings growth over the past year exceeded the industry.
- Debt is not viewed as a risk.
- Dividends are covered by earnings and cash flows.
- Dividend is in the top 25% of dividend payers in the market.
Weakness
- No major weaknesses identified for 002612.
Opportunity
- Annual earnings are forecast to grow for the next 3 years.
- Trading below our estimate of fair value by more than 20%.
Threat
- Annual earnings are forecast to grow slower than the Chinese market.
Next Steps:
Valuation is only one side of the coin in terms of building your investment thesis, and it ideally won't be the sole piece of analysis you scrutinize for a company. DCF models are not the be-all and end-all of investment valuation. Rather it should be seen as a guide to "what assumptions need to be true for this stock to be under/overvalued?" For example, changes in the company's cost of equity or the risk free rate can significantly impact the valuation. What is the reason for the share price sitting below the intrinsic value? For Lancy, we've compiled three relevant items you should further research:
- Risks: You should be aware of the 1 warning sign for Lancy we've uncovered before considering an investment in the company.
- Future Earnings: How does 002612's growth rate compare to its peers and the wider market? Dig deeper into the analyst consensus number for the upcoming years by interacting with our free analyst growth expectation chart.
- Other Solid Businesses: Low debt, high returns on equity and good past performance are fundamental to a strong business. Why not explore our interactive list of stocks with solid business fundamentals to see if there are other companies you may not have considered!
PS. Simply Wall St updates its DCF calculation for every Chinese stock every day, so if you want to find the intrinsic value of any other stock just search here.
New: AI Stock Screener & Alerts
Our new AI Stock Screener scans the market every day to uncover opportunities.
• Dividend Powerhouses (3%+ Yield)
• Undervalued Small Caps with Insider Buying
• High growth Tech and AI Companies
Or build your own from over 50 metrics.
Have feedback on this article? Concerned about the content? Get in touch with us directly. Alternatively, email editorial-team (at) simplywallst.com.
This article by Simply Wall St is general in nature. We provide commentary based on historical data and analyst forecasts only using an unbiased methodology and our articles are not intended to be financial advice. It does not constitute a recommendation to buy or sell any stock, and does not take account of your objectives, or your financial situation. We aim to bring you long-term focused analysis driven by fundamental data. Note that our analysis may not factor in the latest price-sensitive company announcements or qualitative material. Simply Wall St has no position in any stocks mentioned.
About SZSE:002612
Lancy
Engages in the design, production, and sale of branded clothing, apparel, and home textile products in China and internationally.
Outstanding track record established dividend payer.
Similar Companies
Market Insights

Advertisement
Community Narratives
The "Molecular Pencil": Why Beam's Technology is Built to Win
Fair Value US$65.01|65.4% undervalued
DA
Community Contributor
The silent giant behind virtually every advanced chip powering AI, smartphones, and modern infrastructure.
Fair Value US$310.00|6.1% undervalued
OS
Community Contributor
ADP Stock: Solid Fundamentals, But AI Investments Test Its Margin Resilience
Fair Value US$387.77|34.2% undervalued
YI
Community Contributor
MINISO's fair value is projected at 26.69 with an anticipated PE ratio shift of 20x
Fair Value US$24.03|9.6% undervalued
BE
Community Contributor