
Advertisement
Shanghai Challenge Textile Co.,Ltd.'s (SZSE:002486) 31% Dip Still Leaving Some Shareholders Feeling Restless Over Its P/ERatio
Shanghai Challenge Textile Co.,Ltd. (SZSE:002486) shareholders that were waiting for something to happen have been dealt a blow with a 31% share price drop in the last month. The drop over the last 30 days has capped off a tough year for shareholders, with the share price down 48% in that time.
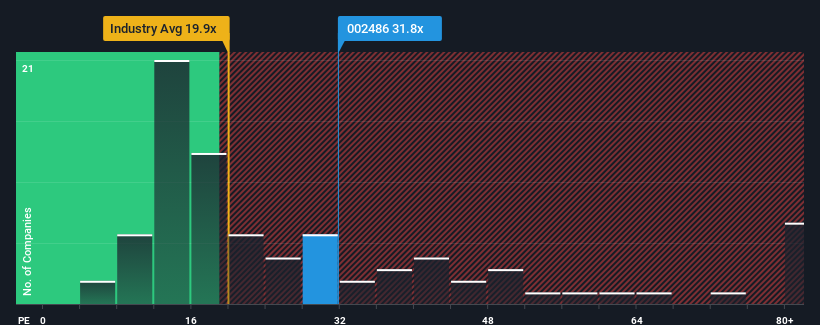
Although its price has dipped substantially, you could still be forgiven for feeling indifferent about Shanghai Challenge TextileLtd's P/E ratio of 31.8x, since the median price-to-earnings (or "P/E") ratio in China is also close to 30x. Although, it's not wise to simply ignore the P/E without explanation as investors may be disregarding a distinct opportunity or a costly mistake.
For instance, Shanghai Challenge TextileLtd's receding earnings in recent times would have to be some food for thought. One possibility is that the P/E is moderate because investors think the company might still do enough to be in line with the broader market in the near future. If you like the company, you'd at least be hoping this is the case so that you could potentially pick up some stock while it's not quite in favour.
View our latest analysis for Shanghai Challenge TextileLtd
What Are Growth Metrics Telling Us About The P/E?
The only time you'd be comfortable seeing a P/E like Shanghai Challenge TextileLtd's is when the company's growth is tracking the market closely.
Retrospectively, the last year delivered a frustrating 59% decrease to the company's bottom line. However, a few very strong years before that means that it was still able to grow EPS by an impressive 133% in total over the last three years. So we can start by confirming that the company has generally done a very good job of growing earnings over that time, even though it had some hiccups along the way.
Comparing that to the market, which is predicted to deliver 38% growth in the next 12 months, the company's momentum is weaker based on recent medium-term annualised earnings results.
With this information, we find it interesting that Shanghai Challenge TextileLtd is trading at a fairly similar P/E to the market. Apparently many investors in the company are less bearish than recent times would indicate and aren't willing to let go of their stock right now. They may be setting themselves up for future disappointment if the P/E falls to levels more in line with recent growth rates.
The Key Takeaway
With its share price falling into a hole, the P/E for Shanghai Challenge TextileLtd looks quite average now. While the price-to-earnings ratio shouldn't be the defining factor in whether you buy a stock or not, it's quite a capable barometer of earnings expectations.
We've established that Shanghai Challenge TextileLtd currently trades on a higher than expected P/E since its recent three-year growth is lower than the wider market forecast. When we see weak earnings with slower than market growth, we suspect the share price is at risk of declining, sending the moderate P/E lower. Unless the recent medium-term conditions improve, it's challenging to accept these prices as being reasonable.
You should always think about risks. Case in point, we've spotted 2 warning signs for Shanghai Challenge TextileLtd you should be aware of.
You might be able to find a better investment than Shanghai Challenge TextileLtd. If you want a selection of possible candidates, check out this free list of interesting companies that trade on a low P/E (but have proven they can grow earnings).
New: Manage All Your Stock Portfolios in One Place
We've created the ultimate portfolio companion for stock investors, and it's free.
• Connect an unlimited number of Portfolios and see your total in one currency
• Be alerted to new Warning Signs or Risks via email or mobile
• Track the Fair Value of your stocks
Have feedback on this article? Concerned about the content? Get in touch with us directly. Alternatively, email editorial-team (at) simplywallst.com.
This article by Simply Wall St is general in nature. We provide commentary based on historical data and analyst forecasts only using an unbiased methodology and our articles are not intended to be financial advice. It does not constitute a recommendation to buy or sell any stock, and does not take account of your objectives, or your financial situation. We aim to bring you long-term focused analysis driven by fundamental data. Note that our analysis may not factor in the latest price-sensitive company announcements or qualitative material. Simply Wall St has no position in any stocks mentioned.
About SZSE:002486
Flawless balance sheet with questionable track record.
Market Insights

Advertisement
Community Narratives
The company that turned a verb into a global necessity and basically runs the modern internet, digital ads, smartphones, maps, and AI.
Fair Value US$300.00|10.2% undervalued
OS
Community Contributor
Flowers Foods Pays A Fair Price For Health
Fair Value US$16.12|20.3% undervalued
NV
Community Contributor
TMX Group will thrive with 33.3% profit margin and enduring market moat
Fair Value CA$49.90|0.1% undervalued
LI
Community Contributor