
Advertisement
- China
- /
- Consumer Durables
- /
- SZSE:002420
There's No Escaping Guangzhou Echom Sci.&Tech.Co.,Ltd's (SZSE:002420) Muted Revenues Despite A 36% Share Price Rise
Guangzhou Echom Sci.&Tech.Co.,Ltd (SZSE:002420) shareholders are no doubt pleased to see that the share price has bounced 36% in the last month, although it is still struggling to make up recently lost ground. Unfortunately, the gains of the last month did little to right the losses of the last year with the stock still down 40% over that time.
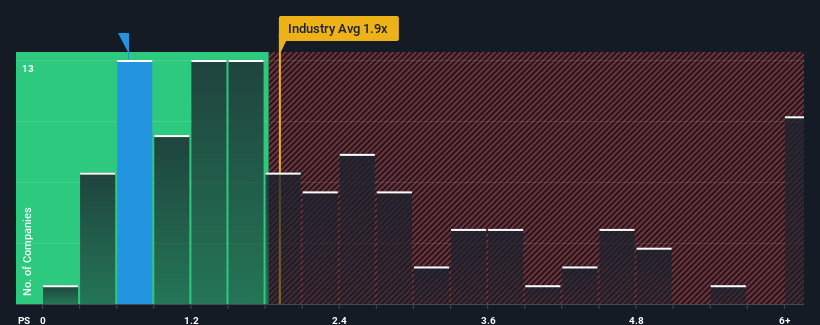
Even after such a large jump in price, Guangzhou Echom Sci.&Tech.Co.Ltd may still be sending buy signals at present with its price-to-sales (or "P/S") ratio of 0.7x, considering almost half of all companies in the Consumer Durables industry in China have P/S ratios greater than 1.9x and even P/S higher than 4x aren't out of the ordinary. Although, it's not wise to just take the P/S at face value as there may be an explanation why it's limited.
See our latest analysis for Guangzhou Echom Sci.&Tech.Co.Ltd
How Has Guangzhou Echom Sci.&Tech.Co.Ltd Performed Recently?
For example, consider that Guangzhou Echom Sci.&Tech.Co.Ltd's financial performance has been poor lately as its revenue has been in decline. One possibility is that the P/S is low because investors think the company won't do enough to avoid underperforming the broader industry in the near future. If you like the company, you'd be hoping this isn't the case so that you could potentially pick up some stock while it's out of favour.
We don't have analyst forecasts, but you can see how recent trends are setting up the company for the future by checking out our free report on Guangzhou Echom Sci.&Tech.Co.Ltd's earnings, revenue and cash flow.What Are Revenue Growth Metrics Telling Us About The Low P/S?
Guangzhou Echom Sci.&Tech.Co.Ltd's P/S ratio would be typical for a company that's only expected to deliver limited growth, and importantly, perform worse than the industry.
Taking a look back first, the company's revenue growth last year wasn't something to get excited about as it posted a disappointing decline of 19%. The last three years don't look nice either as the company has shrunk revenue by 21% in aggregate. Accordingly, shareholders would have felt downbeat about the medium-term rates of revenue growth.
In contrast to the company, the rest of the industry is expected to grow by 12% over the next year, which really puts the company's recent medium-term revenue decline into perspective.
In light of this, it's understandable that Guangzhou Echom Sci.&Tech.Co.Ltd's P/S would sit below the majority of other companies. Nonetheless, there's no guarantee the P/S has reached a floor yet with revenue going in reverse. There's potential for the P/S to fall to even lower levels if the company doesn't improve its top-line growth.
The Final Word
Guangzhou Echom Sci.&Tech.Co.Ltd's stock price has surged recently, but its but its P/S still remains modest. While the price-to-sales ratio shouldn't be the defining factor in whether you buy a stock or not, it's quite a capable barometer of revenue expectations.
As we suspected, our examination of Guangzhou Echom Sci.&Tech.Co.Ltd revealed its shrinking revenue over the medium-term is contributing to its low P/S, given the industry is set to grow. Right now shareholders are accepting the low P/S as they concede future revenue probably won't provide any pleasant surprises either. Unless the recent medium-term conditions improve, they will continue to form a barrier for the share price around these levels.
The company's balance sheet is another key area for risk analysis. Take a look at our free balance sheet analysis for Guangzhou Echom Sci.&Tech.Co.Ltd with six simple checks on some of these key factors.
If you're unsure about the strength of Guangzhou Echom Sci.&Tech.Co.Ltd's business, why not explore our interactive list of stocks with solid business fundamentals for some other companies you may have missed.
New: Manage All Your Stock Portfolios in One Place
We've created the ultimate portfolio companion for stock investors, and it's free.
• Connect an unlimited number of Portfolios and see your total in one currency
• Be alerted to new Warning Signs or Risks via email or mobile
• Track the Fair Value of your stocks
Have feedback on this article? Concerned about the content? Get in touch with us directly. Alternatively, email editorial-team (at) simplywallst.com.
This article by Simply Wall St is general in nature. We provide commentary based on historical data and analyst forecasts only using an unbiased methodology and our articles are not intended to be financial advice. It does not constitute a recommendation to buy or sell any stock, and does not take account of your objectives, or your financial situation. We aim to bring you long-term focused analysis driven by fundamental data. Note that our analysis may not factor in the latest price-sensitive company announcements or qualitative material. Simply Wall St has no position in any stocks mentioned.
About SZSE:002420
Guangzhou Echom Sci.&Tech.Co.Ltd
Engages in the research and development, production, and sales of home appliance, new energy, medical health, and automobile, and other products in China and internationally.
Questionable track record with imperfect balance sheet.
Market Insights

Advertisement
Community Narratives
MINISO's fair value is projected at 26.69 with an anticipated PE ratio shift of 20x
Fair Value US$24.03|11.0% undervalued
BE
Community Contributor
Procter & Gamble: A Dividend Giant Facing Slowing Growth
Fair Value US$119.81|23.3% overvalued
AN
Community Contributor
Eli Lilly's Future Growth Driven by Tirzepatide and Favorable Market Conditions
Fair Value US$1.19k|13.8% undervalued
EA
Community Contributor