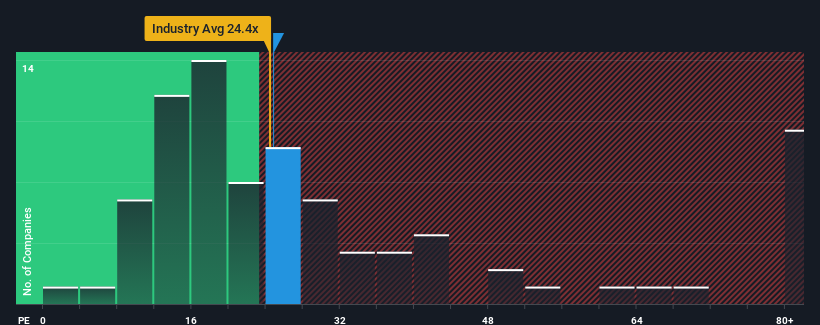
Lacklustre Performance Is Driving Tayho Advanced Materials Group Co., Ltd.'s (SZSE:002254) Low P/E
With a price-to-earnings (or "P/E") ratio of 24.8x Tayho Advanced Materials Group Co., Ltd. (SZSE:002254) may be sending bullish signals at the moment, given that almost half of all companies in China have P/E ratios greater than 31x and even P/E's higher than 56x are not unusual. Nonetheless, we'd need to dig a little deeper to determine if there is a rational basis for the reduced P/E.
With earnings that are retreating more than the market's of late, Tayho Advanced Materials Group has been very sluggish. It seems that many are expecting the dismal earnings performance to persist, which has repressed the P/E. If you still like the company, you'd want its earnings trajectory to turn around before making any decisions. If not, then existing shareholders will probably struggle to get excited about the future direction of the share price.
See our latest analysis for Tayho Advanced Materials Group

What Are Growth Metrics Telling Us About The Low P/E?
In order to justify its P/E ratio, Tayho Advanced Materials Group would need to produce sluggish growth that's trailing the market.
If we review the last year of earnings, dishearteningly the company's profits fell to the tune of 34%. Regardless, EPS has managed to lift by a handy 16% in aggregate from three years ago, thanks to the earlier period of growth. So we can start by confirming that the company has generally done a good job of growing earnings over that time, even though it had some hiccups along the way.
Looking ahead now, EPS is anticipated to climb by 30% during the coming year according to the four analysts following the company. That's shaping up to be materially lower than the 41% growth forecast for the broader market.
In light of this, it's understandable that Tayho Advanced Materials Group's P/E sits below the majority of other companies. Apparently many shareholders weren't comfortable holding on while the company is potentially eyeing a less prosperous future.
What We Can Learn From Tayho Advanced Materials Group's P/E?
Generally, our preference is to limit the use of the price-to-earnings ratio to establishing what the market thinks about the overall health of a company.
As we suspected, our examination of Tayho Advanced Materials Group's analyst forecasts revealed that its inferior earnings outlook is contributing to its low P/E. At this stage investors feel the potential for an improvement in earnings isn't great enough to justify a higher P/E ratio. It's hard to see the share price rising strongly in the near future under these circumstances.
You should always think about risks. Case in point, we've spotted 2 warning signs for Tayho Advanced Materials Group you should be aware of, and 1 of them is a bit unpleasant.
If P/E ratios interest you, you may wish to see this free collection of other companies with strong earnings growth and low P/E ratios.
Valuation is complex, but we're here to simplify it.
Discover if Tayho Advanced Materials Group might be undervalued or overvalued with our detailed analysis, featuring fair value estimates, potential risks, dividends, insider trades, and its financial condition.
Access Free AnalysisHave feedback on this article? Concerned about the content? Get in touch with us directly. Alternatively, email editorial-team (at) simplywallst.com.
This article by Simply Wall St is general in nature. We provide commentary based on historical data and analyst forecasts only using an unbiased methodology and our articles are not intended to be financial advice. It does not constitute a recommendation to buy or sell any stock, and does not take account of your objectives, or your financial situation. We aim to bring you long-term focused analysis driven by fundamental data. Note that our analysis may not factor in the latest price-sensitive company announcements or qualitative material. Simply Wall St has no position in any stocks mentioned.
About SZSE:002254
Tayho Advanced Materials Group
Engages in the research and development, production, and sale of high-tech fibers in China.
High growth potential with mediocre balance sheet.
Market Insights
Community Narratives


