
Advertisement
Harson Trading (China) Co.,Ltd.'s (SHSE:603958) 28% Dip Still Leaving Some Shareholders Feeling Restless Over Its P/SRatio
Harson Trading (China) Co.,Ltd. (SHSE:603958) shareholders won't be pleased to see that the share price has had a very rough month, dropping 28% and undoing the prior period's positive performance. Still, a bad month hasn't completely ruined the past year with the stock gaining 50%, which is great even in a bull market.
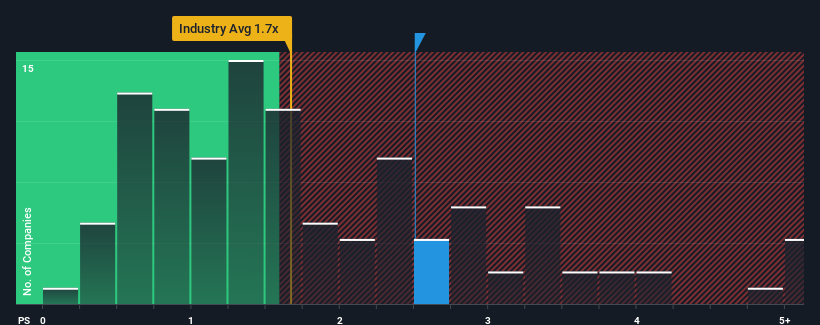
In spite of the heavy fall in price, given close to half the companies operating in China's Luxury industry have price-to-sales ratios (or "P/S") below 1.7x, you may still consider Harson Trading (China)Ltd as a stock to potentially avoid with its 2.5x P/S ratio. Nonetheless, we'd need to dig a little deeper to determine if there is a rational basis for the elevated P/S.
View our latest analysis for Harson Trading (China)Ltd
What Does Harson Trading (China)Ltd's Recent Performance Look Like?
For instance, Harson Trading (China)Ltd's receding revenue in recent times would have to be some food for thought. One possibility is that the P/S is high because investors think the company will still do enough to outperform the broader industry in the near future. However, if this isn't the case, investors might get caught out paying too much for the stock.
Although there are no analyst estimates available for Harson Trading (China)Ltd, take a look at this free data-rich visualisation to see how the company stacks up on earnings, revenue and cash flow.Do Revenue Forecasts Match The High P/S Ratio?
There's an inherent assumption that a company should outperform the industry for P/S ratios like Harson Trading (China)Ltd's to be considered reasonable.
In reviewing the last year of financials, we were disheartened to see the company's revenues fell to the tune of 7.5%. As a result, revenue from three years ago have also fallen 15% overall. Therefore, it's fair to say the revenue growth recently has been undesirable for the company.
In contrast to the company, the rest of the industry is expected to grow by 18% over the next year, which really puts the company's recent medium-term revenue decline into perspective.
With this information, we find it concerning that Harson Trading (China)Ltd is trading at a P/S higher than the industry. It seems most investors are ignoring the recent poor growth rate and are hoping for a turnaround in the company's business prospects. Only the boldest would assume these prices are sustainable as a continuation of recent revenue trends is likely to weigh heavily on the share price eventually.
The Bottom Line On Harson Trading (China)Ltd's P/S
There's still some elevation in Harson Trading (China)Ltd's P/S, even if the same can't be said for its share price recently. Using the price-to-sales ratio alone to determine if you should sell your stock isn't sensible, however it can be a practical guide to the company's future prospects.
We've established that Harson Trading (China)Ltd currently trades on a much higher than expected P/S since its recent revenues have been in decline over the medium-term. With a revenue decline on investors' minds, the likelihood of a souring sentiment is quite high which could send the P/S back in line with what we'd expect. Should recent medium-term revenue trends persist, it would pose a significant risk to existing shareholders' investments and prospective investors will have a hard time accepting the current value of the stock.
And what about other risks? Every company has them, and we've spotted 2 warning signs for Harson Trading (China)Ltd you should know about.
If companies with solid past earnings growth is up your alley, you may wish to see this free collection of other companies with strong earnings growth and low P/E ratios.
Valuation is complex, but we're here to simplify it.
Discover if Harson Trading (China)Ltd might be undervalued or overvalued with our detailed analysis, featuring fair value estimates, potential risks, dividends, insider trades, and its financial condition.
Access Free AnalysisHave feedback on this article? Concerned about the content? Get in touch with us directly. Alternatively, email editorial-team (at) simplywallst.com.
This article by Simply Wall St is general in nature. We provide commentary based on historical data and analyst forecasts only using an unbiased methodology and our articles are not intended to be financial advice. It does not constitute a recommendation to buy or sell any stock, and does not take account of your objectives, or your financial situation. We aim to bring you long-term focused analysis driven by fundamental data. Note that our analysis may not factor in the latest price-sensitive company announcements or qualitative material. Simply Wall St has no position in any stocks mentioned.
About SHSE:603958
Harson Trading (China)Ltd
Engages in the design, development, production, and wholesale of leather products in China and internationally.
Excellent balance sheet and overvalued.
Similar Companies
Market Insights

Advertisement
Community Narratives
MINISO's fair value is projected at 26.69 with an anticipated PE ratio shift of 20x
Fair Value US$24.03|9.0% undervalued
BE
Community Contributor
Procter & Gamble: A Dividend Giant Facing Slowing Growth
Fair Value US$119.81|23.5% overvalued
AN
Community Contributor
Eli Lilly's Future Growth Driven by Tirzepatide and Favorable Market Conditions
Fair Value US$1.19k|14.4% undervalued
EA
Community Contributor