Ningbo Peacebird FashionLtd (SHSE:603877) stock falls 7.5% in past week as three-year earnings and shareholder returns continue downward trend


Ningbo Peacebird Fashion Co.,Ltd. (SHSE:603877) shareholders should be happy to see the share price up 19% in the last month. But over the last three years we've seen a quite serious decline. Tragically, the share price declined 67% in that time. Some might say the recent bounce is to be expected after such a bad drop. After all, could be that the fall was overdone.
After losing 7.5% this past week, it's worth investigating the company's fundamentals to see what we can infer from past performance.
View our latest analysis for Ningbo Peacebird FashionLtd
While the efficient markets hypothesis continues to be taught by some, it has been proven that markets are over-reactive dynamic systems, and investors are not always rational. One way to examine how market sentiment has changed over time is to look at the interaction between a company's share price and its earnings per share (EPS).
During the three years that the share price fell, Ningbo Peacebird FashionLtd's earnings per share (EPS) dropped by 30% each year. The 31% average annual share price decline is remarkably close to the EPS decline. That suggests that the market sentiment around the company hasn't changed much over that time, despite the disappointment. Rather, the share price has approximately tracked EPS growth.
You can see below how EPS has changed over time (discover the exact values by clicking on the image).
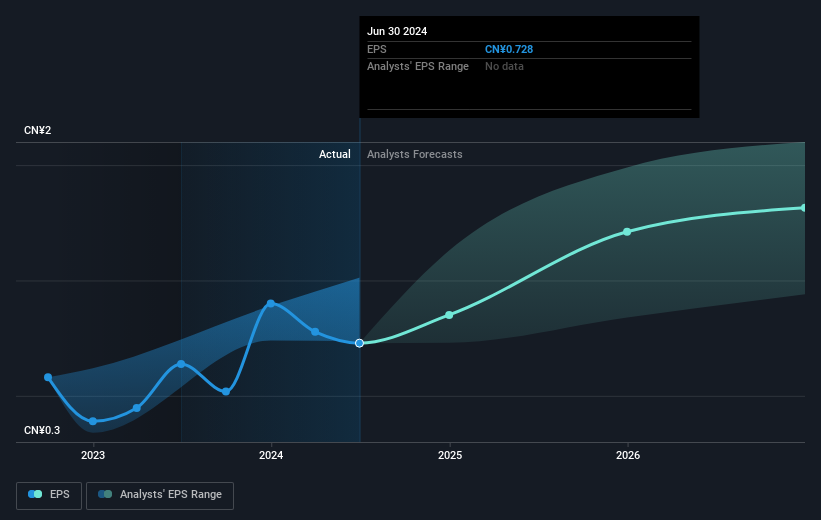
We know that Ningbo Peacebird FashionLtd has improved its bottom line lately, but is it going to grow revenue? You could check out this free report showing analyst revenue forecasts.
What About Dividends?
As well as measuring the share price return, investors should also consider the total shareholder return (TSR). The TSR is a return calculation that accounts for the value of cash dividends (assuming that any dividend received was reinvested) and the calculated value of any discounted capital raisings and spin-offs. So for companies that pay a generous dividend, the TSR is often a lot higher than the share price return. We note that for Ningbo Peacebird FashionLtd the TSR over the last 3 years was -64%, which is better than the share price return mentioned above. And there's no prize for guessing that the dividend payments largely explain the divergence!
A Different Perspective
We regret to report that Ningbo Peacebird FashionLtd shareholders are down 23% for the year (even including dividends). Unfortunately, that's worse than the broader market decline of 0.6%. Having said that, it's inevitable that some stocks will be oversold in a falling market. The key is to keep your eyes on the fundamental developments. On the bright side, long term shareholders have made money, with a gain of 1.4% per year over half a decade. It could be that the recent sell-off is an opportunity, so it may be worth checking the fundamental data for signs of a long term growth trend. While it is well worth considering the different impacts that market conditions can have on the share price, there are other factors that are even more important. For instance, we've identified 2 warning signs for Ningbo Peacebird FashionLtd that you should be aware of.
If you like to buy stocks alongside management, then you might just love this free list of companies. (Hint: many of them are unnoticed AND have attractive valuation).
Please note, the market returns quoted in this article reflect the market weighted average returns of stocks that currently trade on Chinese exchanges.
Valuation is complex, but we're here to simplify it.
Discover if Ningbo Peacebird FashionLtd might be undervalued or overvalued with our detailed analysis, featuring fair value estimates, potential risks, dividends, insider trades, and its financial condition.
Access Free AnalysisHave feedback on this article? Concerned about the content? Get in touch with us directly. Alternatively, email editorial-team (at) simplywallst.com.
This article by Simply Wall St is general in nature. We provide commentary based on historical data and analyst forecasts only using an unbiased methodology and our articles are not intended to be financial advice. It does not constitute a recommendation to buy or sell any stock, and does not take account of your objectives, or your financial situation. We aim to bring you long-term focused analysis driven by fundamental data. Note that our analysis may not factor in the latest price-sensitive company announcements or qualitative material. Simply Wall St has no position in any stocks mentioned.
About SHSE:603877
Ningbo Peacebird FashionLtd
Operates as a consumer-centric fashion brand retailer in China.
Excellent balance sheet average dividend payer.
