Investors three-year losses continue as Ningbo Peacebird FashionLtd (SHSE:603877) dips a further 4.8% this week, earnings continue to decline


If you are building a properly diversified stock portfolio, the chances are some of your picks will perform badly. Long term Ningbo Peacebird Fashion Co.,Ltd. (SHSE:603877) shareholders know that all too well, since the share price is down considerably over three years. Unfortunately, they have held through a 72% decline in the share price in that time. The more recent news is of little comfort, with the share price down 35% in a year.
If the past week is anything to go by, investor sentiment for Ningbo Peacebird FashionLtd isn't positive, so let's see if there's a mismatch between fundamentals and the share price.
See our latest analysis for Ningbo Peacebird FashionLtd
While the efficient markets hypothesis continues to be taught by some, it has been proven that markets are over-reactive dynamic systems, and investors are not always rational. By comparing earnings per share (EPS) and share price changes over time, we can get a feel for how investor attitudes to a company have morphed over time.
During the three years that the share price fell, Ningbo Peacebird FashionLtd's earnings per share (EPS) dropped by 26% each year. The share price decline of 34% is actually steeper than the EPS slippage. So it seems the market was too confident about the business, in the past.
The company's earnings per share (over time) is depicted in the image below (click to see the exact numbers).
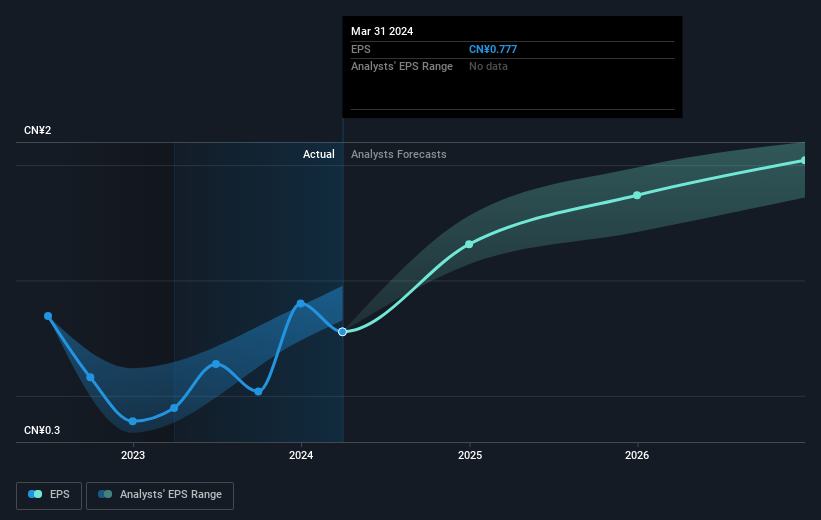
We know that Ningbo Peacebird FashionLtd has improved its bottom line lately, but is it going to grow revenue? If you're interested, you could check this free report showing consensus revenue forecasts.
What About Dividends?
It is important to consider the total shareholder return, as well as the share price return, for any given stock. Whereas the share price return only reflects the change in the share price, the TSR includes the value of dividends (assuming they were reinvested) and the benefit of any discounted capital raising or spin-off. It's fair to say that the TSR gives a more complete picture for stocks that pay a dividend. As it happens, Ningbo Peacebird FashionLtd's TSR for the last 3 years was -69%, which exceeds the share price return mentioned earlier. The dividends paid by the company have thusly boosted the total shareholder return.
A Different Perspective
We regret to report that Ningbo Peacebird FashionLtd shareholders are down 32% for the year (even including dividends). Unfortunately, that's worse than the broader market decline of 7.4%. However, it could simply be that the share price has been impacted by broader market jitters. It might be worth keeping an eye on the fundamentals, in case there's a good opportunity. Longer term investors wouldn't be so upset, since they would have made 1.3%, each year, over five years. If the fundamental data continues to indicate long term sustainable growth, the current sell-off could be an opportunity worth considering. It's always interesting to track share price performance over the longer term. But to understand Ningbo Peacebird FashionLtd better, we need to consider many other factors. For example, we've discovered 2 warning signs for Ningbo Peacebird FashionLtd that you should be aware of before investing here.
We will like Ningbo Peacebird FashionLtd better if we see some big insider buys. While we wait, check out this free list of undervalued stocks (mostly small caps) with considerable, recent, insider buying.
Please note, the market returns quoted in this article reflect the market weighted average returns of stocks that currently trade on Chinese exchanges.
Valuation is complex, but we're here to simplify it.
Discover if Ningbo Peacebird FashionLtd might be undervalued or overvalued with our detailed analysis, featuring fair value estimates, potential risks, dividends, insider trades, and its financial condition.
Access Free AnalysisHave feedback on this article? Concerned about the content? Get in touch with us directly. Alternatively, email editorial-team (at) simplywallst.com.
This article by Simply Wall St is general in nature. We provide commentary based on historical data and analyst forecasts only using an unbiased methodology and our articles are not intended to be financial advice. It does not constitute a recommendation to buy or sell any stock, and does not take account of your objectives, or your financial situation. We aim to bring you long-term focused analysis driven by fundamental data. Note that our analysis may not factor in the latest price-sensitive company announcements or qualitative material. Simply Wall St has no position in any stocks mentioned.
About SHSE:603877
Ningbo Peacebird FashionLtd
Operates as a consumer-centric fashion brand retailer in China.
Very undervalued with excellent balance sheet and pays a dividend.
