
Advertisement
- China
- /
- Commercial Services
- /
- SZSE:300355
M-Grass Ecology And Environment (Group) (SZSE:300355) pulls back 5.2% this week, but still delivers shareholders favorable 11% CAGR over 5 years
Generally speaking the aim of active stock picking is to find companies that provide returns that are superior to the market average. And while active stock picking involves risks (and requires diversification) it can also provide excess returns. To wit, the M-Grass Ecology And Environment (Group) share price has climbed 66% in five years, easily topping the market return of 12% (ignoring dividends).
Since the long term performance has been good but there's been a recent pullback of 5.2%, let's check if the fundamentals match the share price.
See our latest analysis for M-Grass Ecology And Environment (Group)
To quote Buffett, 'Ships will sail around the world but the Flat Earth Society will flourish. There will continue to be wide discrepancies between price and value in the marketplace...' One flawed but reasonable way to assess how sentiment around a company has changed is to compare the earnings per share (EPS) with the share price.
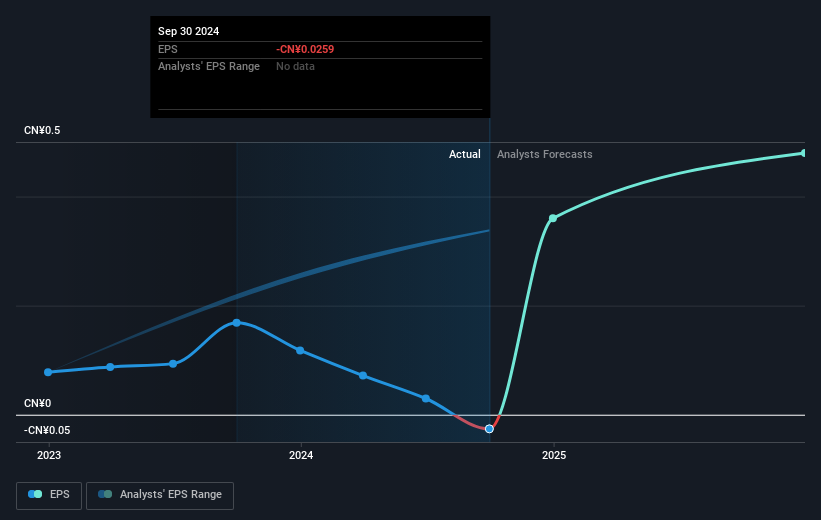
During five years of share price growth, M-Grass Ecology And Environment (Group) achieved compound earnings per share (EPS) growth of 5.5% per year. This EPS growth is slower than the share price growth of 11% per year, over the same period. So it's fair to assume the market has a higher opinion of the business than it did five years ago. That's not necessarily surprising considering the five-year track record of earnings growth.
The graphic below depicts how EPS has changed over time (unveil the exact values by clicking on the image).
Dive deeper into M-Grass Ecology And Environment (Group)'s key metrics by checking this interactive graph of M-Grass Ecology And Environment (Group)'s earnings, revenue and cash flow.
What About Dividends?
As well as measuring the share price return, investors should also consider the total shareholder return (TSR). The TSR is a return calculation that accounts for the value of cash dividends (assuming that any dividend received was reinvested) and the calculated value of any discounted capital raisings and spin-offs. Arguably, the TSR gives a more comprehensive picture of the return generated by a stock. In the case of M-Grass Ecology And Environment (Group), it has a TSR of 71% for the last 5 years. That exceeds its share price return that we previously mentioned. This is largely a result of its dividend payments!
A Different Perspective
It's good to see that M-Grass Ecology And Environment (Group) has rewarded shareholders with a total shareholder return of 57% in the last twelve months. Of course, that includes the dividend. Since the one-year TSR is better than the five-year TSR (the latter coming in at 11% per year), it would seem that the stock's performance has improved in recent times. Given the share price momentum remains strong, it might be worth taking a closer look at the stock, lest you miss an opportunity. It's always interesting to track share price performance over the longer term. But to understand M-Grass Ecology And Environment (Group) better, we need to consider many other factors. Consider risks, for instance. Every company has them, and we've spotted 2 warning signs for M-Grass Ecology And Environment (Group) you should know about.
Of course M-Grass Ecology And Environment (Group) may not be the best stock to buy. So you may wish to see this free collection of growth stocks.
Please note, the market returns quoted in this article reflect the market weighted average returns of stocks that currently trade on Chinese exchanges.
New: Manage All Your Stock Portfolios in One Place
We've created the ultimate portfolio companion for stock investors, and it's free.
• Connect an unlimited number of Portfolios and see your total in one currency
• Be alerted to new Warning Signs or Risks via email or mobile
• Track the Fair Value of your stocks
Have feedback on this article? Concerned about the content? Get in touch with us directly. Alternatively, email editorial-team (at) simplywallst.com.
This article by Simply Wall St is general in nature. We provide commentary based on historical data and analyst forecasts only using an unbiased methodology and our articles are not intended to be financial advice. It does not constitute a recommendation to buy or sell any stock, and does not take account of your objectives, or your financial situation. We aim to bring you long-term focused analysis driven by fundamental data. Note that our analysis may not factor in the latest price-sensitive company announcements or qualitative material. Simply Wall St has no position in any stocks mentioned.
About SZSE:300355
M-Grass Ecology And Environment (Group)
M-Grass Ecology And Environment (Group) Co., Ltd.
Fair value with imperfect balance sheet.
Market Insights

Advertisement
Community Narratives
MINISO's fair value is projected at 26.69 with an anticipated PE ratio shift of 20x
Fair Value US$24.03|11.0% undervalued
BE
Community Contributor
Procter & Gamble: A Dividend Giant Facing Slowing Growth
Fair Value US$119.81|23.3% overvalued
AN
Community Contributor
Eli Lilly's Future Growth Driven by Tirzepatide and Favorable Market Conditions
Fair Value US$1.19k|13.8% undervalued
EA
Community Contributor