
Advertisement
- China
- /
- Commercial Services
- /
- SHSE:688701
Zhejiang Zone-King Environmental Sci&Tech Co., Ltd.'s (SHSE:688701) 34% Dip In Price Shows Sentiment Is Matching Revenues
Unfortunately for some shareholders, the Zhejiang Zone-King Environmental Sci&Tech Co., Ltd. (SHSE:688701) share price has dived 34% in the last thirty days, prolonging recent pain. For any long-term shareholders, the last month ends a year to forget by locking in a 53% share price decline.
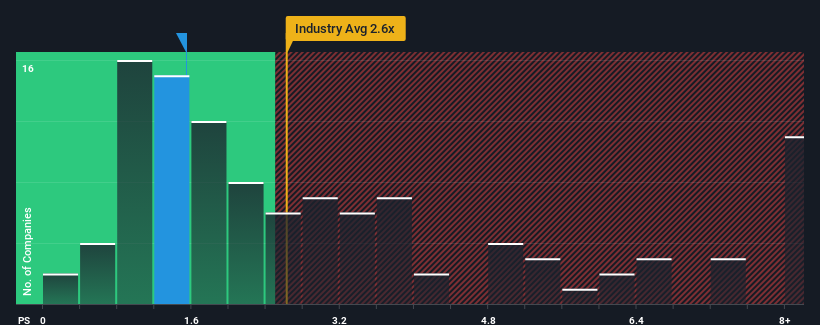
After such a large drop in price, Zhejiang Zone-King Environmental Sci&Tech's price-to-sales (or "P/S") ratio of 1.5x might make it look like a buy right now compared to the Commercial Services industry in China, where around half of the companies have P/S ratios above 2.6x and even P/S above 5x are quite common. Although, it's not wise to just take the P/S at face value as there may be an explanation why it's limited.
See our latest analysis for Zhejiang Zone-King Environmental Sci&Tech
What Does Zhejiang Zone-King Environmental Sci&Tech's Recent Performance Look Like?
Recent times have been quite advantageous for Zhejiang Zone-King Environmental Sci&Tech as its revenue has been rising very briskly. One possibility is that the P/S ratio is low because investors think this strong revenue growth might actually underperform the broader industry in the near future. If that doesn't eventuate, then existing shareholders have reason to be quite optimistic about the future direction of the share price.
Want the full picture on earnings, revenue and cash flow for the company? Then our free report on Zhejiang Zone-King Environmental Sci&Tech will help you shine a light on its historical performance.Do Revenue Forecasts Match The Low P/S Ratio?
The only time you'd be truly comfortable seeing a P/S as low as Zhejiang Zone-King Environmental Sci&Tech's is when the company's growth is on track to lag the industry.
Retrospectively, the last year delivered an exceptional 42% gain to the company's top line. Although, its longer-term performance hasn't been as strong with three-year revenue growth being relatively non-existent overall. Accordingly, shareholders probably wouldn't have been overly satisfied with the unstable medium-term growth rates.
Comparing the recent medium-term revenue trends against the industry's one-year growth forecast of 28% shows it's noticeably less attractive.
With this information, we can see why Zhejiang Zone-King Environmental Sci&Tech is trading at a P/S lower than the industry. It seems most investors are expecting to see the recent limited growth rates continue into the future and are only willing to pay a reduced amount for the stock.
What Does Zhejiang Zone-King Environmental Sci&Tech's P/S Mean For Investors?
Zhejiang Zone-King Environmental Sci&Tech's recently weak share price has pulled its P/S back below other Commercial Services companies. It's argued the price-to-sales ratio is an inferior measure of value within certain industries, but it can be a powerful business sentiment indicator.
In line with expectations, Zhejiang Zone-King Environmental Sci&Tech maintains its low P/S on the weakness of its recent three-year growth being lower than the wider industry forecast. At this stage investors feel the potential for an improvement in revenue isn't great enough to justify a higher P/S ratio. Unless the recent medium-term conditions improve, they will continue to form a barrier for the share price around these levels.
Having said that, be aware Zhejiang Zone-King Environmental Sci&Tech is showing 4 warning signs in our investment analysis, and 3 of those are potentially serious.
If strong companies turning a profit tickle your fancy, then you'll want to check out this free list of interesting companies that trade on a low P/E (but have proven they can grow earnings).
Valuation is complex, but we're here to simplify it.
Discover if Zhejiang Zone-King Environmental Sci&Tech might be undervalued or overvalued with our detailed analysis, featuring fair value estimates, potential risks, dividends, insider trades, and its financial condition.
Access Free AnalysisHave feedback on this article? Concerned about the content? Get in touch with us directly. Alternatively, email editorial-team (at) simplywallst.com.
This article by Simply Wall St is general in nature. We provide commentary based on historical data and analyst forecasts only using an unbiased methodology and our articles are not intended to be financial advice. It does not constitute a recommendation to buy or sell any stock, and does not take account of your objectives, or your financial situation. We aim to bring you long-term focused analysis driven by fundamental data. Note that our analysis may not factor in the latest price-sensitive company announcements or qualitative material. Simply Wall St has no position in any stocks mentioned.
About SHSE:688701
Zhejiang Zone-King Environmental Sci&Tech
Zhejiang Zone-King Environmental Sci&Tech Co., Ltd.
Adequate balance sheet and slightly overvalued.
Market Insights

Advertisement
Community Narratives
MicroVision will explode future revenue by 380.37% with a vision towards success
Fair Value US$60|98.4% undervalued
TH
Community Contributor
The Indispensable Artery for a New North American Economy
Fair Value CA$132.87|0.7% overvalued
TI
Community Contributor
Recently Updated Narratives
CE

cementafriend on Constellation Energy ·
Constellation Energy Dividends and Growth
Fair Value:US$348.054.7% overvalued
2 followersusers have followed this narrative
0 commentsusers have commented on this narrative
0 likesusers have liked this narrative
KH

Khagani on CoreWeave ·
CoreWeave's Revenue Expected to Rocket 77.88% in 5-Year Forecast
Fair Value:US$11033.5% undervalued
1 followerusers have followed this narrative
0 commentsusers have commented on this narrative
0 likesusers have liked this narrative
PO

PortfolioPlus on Bisalloy Steel Group ·
Bisalloy Steel Group will shine with a projected profit margin increase of 12.8%
Fair Value:AU$6.7118.0% undervalued
2 followersusers have followed this narrative
0 commentsusers have commented on this narrative
0 likesusers have liked this narrative
Popular Narratives
TH

TheWallstreetKing on MicroVision ·
MicroVision will explode future revenue by 380.37% with a vision towards success
Fair Value:US$6098.4% undervalued
103 followersusers have followed this narrative
10 commentsusers have commented on this narrative
20 likesusers have liked this narrative
AN


AnalystConsensusTarget on NVIDIA ·
NVDA: Expanding AI Demand Will Drive Major Data Center Investments Through 2026
Fair Value:US$250.3929.3% undervalued
936 followersusers have followed this narrative
6 commentsusers have commented on this narrative
23 likesusers have liked this narrative
OS


oscargarcia on Alphabet ·
The company that turned a verb into a global necessity and basically runs the modern internet, digital ads, smartphones, maps, and AI.
Fair Value:US$3405.8% undervalued
141 followersusers have followed this narrative
6 commentsusers have commented on this narrative
18 likesusers have liked this narrative