
Advertisement
- China
- /
- Electrical
- /
- SZSE:301012
Revenues Not Telling The Story For Jiangsu Yangdian Science & Technology Co. Ltd. (SZSE:301012) After Shares Rise 27%

Jiangsu Yangdian Science & Technology Co. Ltd. (SZSE:301012) shares have continued their recent momentum with a 27% gain in the last month alone. But the gains over the last month weren't enough to make shareholders whole, as the share price is still down 3.3% in the last twelve months.
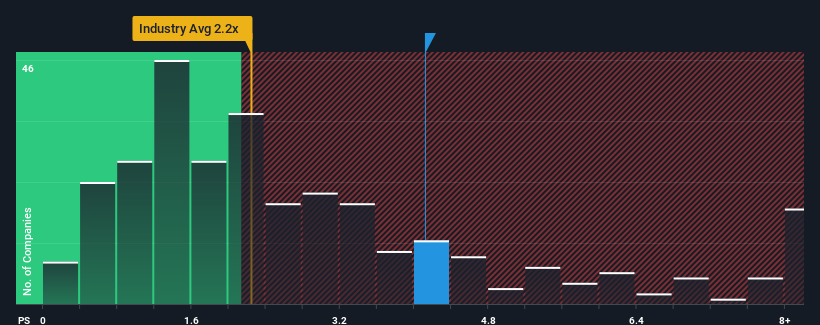
Following the firm bounce in price, given close to half the companies operating in China's Electrical industry have price-to-sales ratios (or "P/S") below 2.2x, you may consider Jiangsu Yangdian Science & Technology as a stock to potentially avoid with its 4.1x P/S ratio. Although, it's not wise to just take the P/S at face value as there may be an explanation why it's as high as it is.
Check out our latest analysis for Jiangsu Yangdian Science & Technology
What Does Jiangsu Yangdian Science & Technology's P/S Mean For Shareholders?
With revenue growth that's exceedingly strong of late, Jiangsu Yangdian Science & Technology has been doing very well. Perhaps the market is expecting future revenue performance to outperform the wider market, which has seemingly got people interested in the stock. However, if this isn't the case, investors might get caught out paying too much for the stock.
Although there are no analyst estimates available for Jiangsu Yangdian Science & Technology, take a look at this free data-rich visualisation to see how the company stacks up on earnings, revenue and cash flow.Do Revenue Forecasts Match The High P/S Ratio?
There's an inherent assumption that a company should outperform the industry for P/S ratios like Jiangsu Yangdian Science & Technology's to be considered reasonable.
If we review the last year of revenue growth, the company posted a terrific increase of 40%. The strong recent performance means it was also able to grow revenue by 56% in total over the last three years. Accordingly, shareholders would have definitely welcomed those medium-term rates of revenue growth.
Comparing the recent medium-term revenue trends against the industry's one-year growth forecast of 26% shows it's noticeably less attractive.
In light of this, it's alarming that Jiangsu Yangdian Science & Technology's P/S sits above the majority of other companies. Apparently many investors in the company are way more bullish than recent times would indicate and aren't willing to let go of their stock at any price. Only the boldest would assume these prices are sustainable as a continuation of recent revenue trends is likely to weigh heavily on the share price eventually.
The Final Word
Jiangsu Yangdian Science & Technology shares have taken a big step in a northerly direction, but its P/S is elevated as a result. It's argued the price-to-sales ratio is an inferior measure of value within certain industries, but it can be a powerful business sentiment indicator.
Our examination of Jiangsu Yangdian Science & Technology revealed its poor three-year revenue trends aren't detracting from the P/S as much as we though, given they look worse than current industry expectations. Right now we aren't comfortable with the high P/S as this revenue performance isn't likely to support such positive sentiment for long. Unless there is a significant improvement in the company's medium-term performance, it will be difficult to prevent the P/S ratio from declining to a more reasonable level.
Plus, you should also learn about these 4 warning signs we've spotted with Jiangsu Yangdian Science & Technology (including 2 which shouldn't be ignored).
If strong companies turning a profit tickle your fancy, then you'll want to check out this free list of interesting companies that trade on a low P/E (but have proven they can grow earnings).
New: Manage All Your Stock Portfolios in One Place
We've created the ultimate portfolio companion for stock investors, and it's free.
• Connect an unlimited number of Portfolios and see your total in one currency
• Be alerted to new Warning Signs or Risks via email or mobile
• Track the Fair Value of your stocks
Have feedback on this article? Concerned about the content? Get in touch with us directly. Alternatively, email editorial-team (at) simplywallst.com.
This article by Simply Wall St is general in nature. We provide commentary based on historical data and analyst forecasts only using an unbiased methodology and our articles are not intended to be financial advice. It does not constitute a recommendation to buy or sell any stock, and does not take account of your objectives, or your financial situation. We aim to bring you long-term focused analysis driven by fundamental data. Note that our analysis may not factor in the latest price-sensitive company announcements or qualitative material. Simply Wall St has no position in any stocks mentioned.
About SZSE:301012
Jiangsu Yangdian Science & Technology
Jiangsu Yangdian Science & Technology Co.
Excellent balance sheet with acceptable track record.
Market Insights


Advertisement
Community Narratives
Alphabet: The Under-appreciated Compounder Hiding in Plain Sight
Fair Value US$282.83|31.8% undervalued
BL
Community Contributor
Planet Labs: At The Heart Of The Emerging New Space Boom
Fair Value US$11.31|44.7% undervalued
AN
Community Contributor
Exxon in Guyana 5 year forecast Low $135 to High $189
Fair Value US$189.00|40.9% undervalued
AG
Community Contributor