
Advertisement
- China
- /
- Construction
- /
- SZSE:300284
These 4 Measures Indicate That JSTI Group (SZSE:300284) Is Using Debt Reasonably Well
Warren Buffett famously said, 'Volatility is far from synonymous with risk.' So it seems the smart money knows that debt - which is usually involved in bankruptcies - is a very important factor, when you assess how risky a company is. We note that JSTI Group (SZSE:300284) does have debt on its balance sheet. But should shareholders be worried about its use of debt?
Why Does Debt Bring Risk?
Generally speaking, debt only becomes a real problem when a company can't easily pay it off, either by raising capital or with its own cash flow. Ultimately, if the company can't fulfill its legal obligations to repay debt, shareholders could walk away with nothing. However, a more common (but still painful) scenario is that it has to raise new equity capital at a low price, thus permanently diluting shareholders. Having said that, the most common situation is where a company manages its debt reasonably well - and to its own advantage. The first thing to do when considering how much debt a business uses is to look at its cash and debt together.
View our latest analysis for JSTI Group
What Is JSTI Group's Debt?
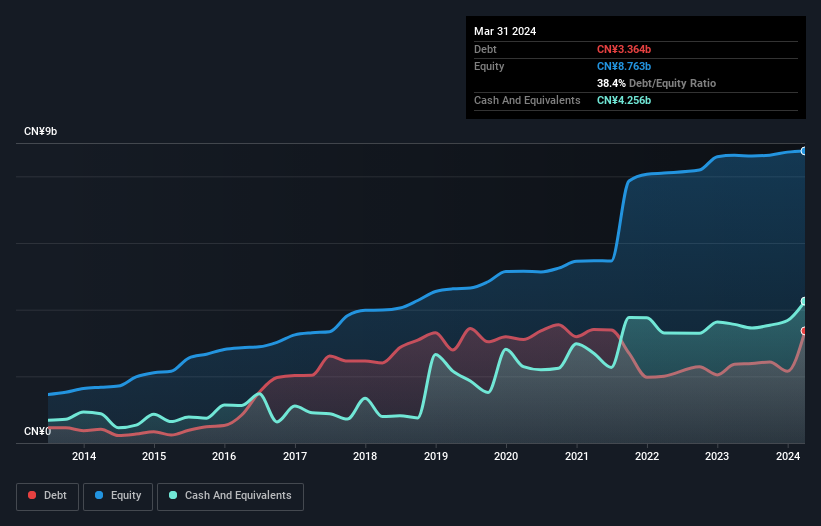
The image below, which you can click on for greater detail, shows that at March 2024 JSTI Group had debt of CN¥3.36b, up from CN¥2.36b in one year. However, it does have CN¥4.26b in cash offsetting this, leading to net cash of CN¥892.4m.
How Strong Is JSTI Group's Balance Sheet?
The latest balance sheet data shows that JSTI Group had liabilities of CN¥7.46b due within a year, and liabilities of CN¥258.2m falling due after that. On the other hand, it had cash of CN¥4.26b and CN¥8.52b worth of receivables due within a year. So it can boast CN¥5.06b more liquid assets than total liabilities.
This surplus liquidity suggests that JSTI Group's balance sheet could take a hit just as well as Homer Simpson's head can take a punch. On this view, lenders should feel as safe as the beloved of a black-belt karate master. Simply put, the fact that JSTI Group has more cash than debt is arguably a good indication that it can manage its debt safely.
In fact JSTI Group's saving grace is its low debt levels, because its EBIT has tanked 52% in the last twelve months. When it comes to paying off debt, falling earnings are no more useful than sugary sodas are for your health. When analysing debt levels, the balance sheet is the obvious place to start. But it is future earnings, more than anything, that will determine JSTI Group's ability to maintain a healthy balance sheet going forward. So if you're focused on the future you can check out this free report showing analyst profit forecasts.
Finally, a business needs free cash flow to pay off debt; accounting profits just don't cut it. JSTI Group may have net cash on the balance sheet, but it is still interesting to look at how well the business converts its earnings before interest and tax (EBIT) to free cash flow, because that will influence both its need for, and its capacity to manage debt. In the last three years, JSTI Group's free cash flow amounted to 26% of its EBIT, less than we'd expect. That's not great, when it comes to paying down debt.
Summing Up
While it is always sensible to investigate a company's debt, in this case JSTI Group has CN¥892.4m in net cash and a decent-looking balance sheet. So we are not troubled with JSTI Group's debt use. When analysing debt levels, the balance sheet is the obvious place to start. But ultimately, every company can contain risks that exist outside of the balance sheet. Case in point: We've spotted 3 warning signs for JSTI Group you should be aware of, and 1 of them is concerning.
If, after all that, you're more interested in a fast growing company with a rock-solid balance sheet, then check out our list of net cash growth stocks without delay.
New: Manage All Your Stock Portfolios in One Place
We've created the ultimate portfolio companion for stock investors, and it's free.
• Connect an unlimited number of Portfolios and see your total in one currency
• Be alerted to new Warning Signs or Risks via email or mobile
• Track the Fair Value of your stocks
Have feedback on this article? Concerned about the content? Get in touch with us directly. Alternatively, email editorial-team (at) simplywallst.com.
This article by Simply Wall St is general in nature. We provide commentary based on historical data and analyst forecasts only using an unbiased methodology and our articles are not intended to be financial advice. It does not constitute a recommendation to buy or sell any stock, and does not take account of your objectives, or your financial situation. We aim to bring you long-term focused analysis driven by fundamental data. Note that our analysis may not factor in the latest price-sensitive company announcements or qualitative material. Simply Wall St has no position in any stocks mentioned.
About SZSE:300284
JSTI Group
Provides infrastructure solutions in China and internationally.
Excellent balance sheet average dividend payer.
Market Insights

Advertisement
Community Narratives
Finding The True Value Of A Logistics Powerhouse
Fair Value US$95.21|8.4% undervalued
NV
Community Contributor
Paradigm Biopharmaceuticals Will Lead Osteoarthritis Treatment with Zilosul's FDA Success
Fair Value AU$5.50|91.9% undervalued
AM
Community Contributor
Barrick Mining (ABX:CA): A Gold Hedge against a U.S. Shutdown
Fair Value CA$60.00|24.2% undervalued
GM
Community Contributor