
Advertisement
- China
- /
- Construction
- /
- SZSE:300008
After Leaping 50% Bestway Marine & Energy Technology Co.,Ltd (SZSE:300008) Shares Are Not Flying Under The Radar
Bestway Marine & Energy Technology Co.,Ltd (SZSE:300008) shares have had a really impressive month, gaining 50% after a shaky period beforehand. Looking back a bit further, it's encouraging to see the stock is up 78% in the last year.
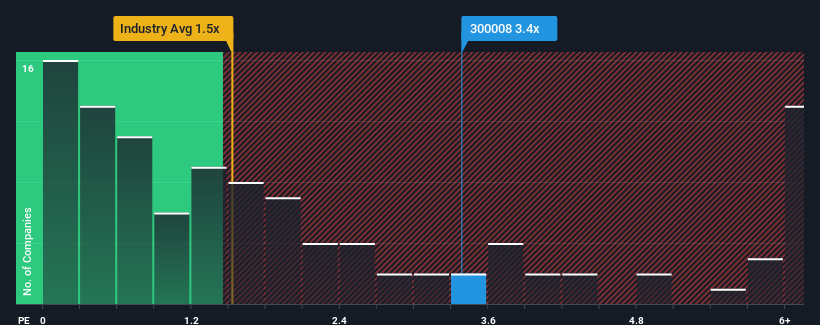
Since its price has surged higher, when almost half of the companies in China's Construction industry have price-to-sales ratios (or "P/S") below 1.5x, you may consider Bestway Marine & Energy TechnologyLtd as a stock probably not worth researching with its 3.4x P/S ratio. Although, it's not wise to just take the P/S at face value as there may be an explanation why it's as high as it is.
See our latest analysis for Bestway Marine & Energy TechnologyLtd
What Does Bestway Marine & Energy TechnologyLtd's P/S Mean For Shareholders?
Bestway Marine & Energy TechnologyLtd has been doing a good job lately as it's been growing revenue at a solid pace. It might be that many expect the respectable revenue performance to beat most other companies over the coming period, which has increased investors’ willingness to pay up for the stock. You'd really hope so, otherwise you're paying a pretty hefty price for no particular reason.
Want the full picture on earnings, revenue and cash flow for the company? Then our free report on Bestway Marine & Energy TechnologyLtd will help you shine a light on its historical performance.How Is Bestway Marine & Energy TechnologyLtd's Revenue Growth Trending?
Bestway Marine & Energy TechnologyLtd's P/S ratio would be typical for a company that's expected to deliver solid growth, and importantly, perform better than the industry.
Retrospectively, the last year delivered a decent 10% gain to the company's revenues. Pleasingly, revenue has also lifted 264% in aggregate from three years ago, partly thanks to the last 12 months of growth. So we can start by confirming that the company has done a great job of growing revenues over that time.
Comparing that recent medium-term revenue trajectory with the industry's one-year growth forecast of 12% shows it's noticeably more attractive.
In light of this, it's understandable that Bestway Marine & Energy TechnologyLtd's P/S sits above the majority of other companies. Presumably shareholders aren't keen to offload something they believe will continue to outmanoeuvre the wider industry.
What Does Bestway Marine & Energy TechnologyLtd's P/S Mean For Investors?
The large bounce in Bestway Marine & Energy TechnologyLtd's shares has lifted the company's P/S handsomely. Generally, our preference is to limit the use of the price-to-sales ratio to establishing what the market thinks about the overall health of a company.
It's no surprise that Bestway Marine & Energy TechnologyLtd can support its high P/S given the strong revenue growth its experienced over the last three-year is superior to the current industry outlook. In the eyes of shareholders, the probability of a continued growth trajectory is great enough to prevent the P/S from pulling back. Barring any significant changes to the company's ability to make money, the share price should continue to be propped up.
There are also other vital risk factors to consider before investing and we've discovered 1 warning sign for Bestway Marine & Energy TechnologyLtd that you should be aware of.
It's important to make sure you look for a great company, not just the first idea you come across. So if growing profitability aligns with your idea of a great company, take a peek at this free list of interesting companies with strong recent earnings growth (and a low P/E).
Valuation is complex, but we're here to simplify it.
Discover if Bestway Marine & Energy TechnologyLtd might be undervalued or overvalued with our detailed analysis, featuring fair value estimates, potential risks, dividends, insider trades, and its financial condition.
Access Free AnalysisHave feedback on this article? Concerned about the content? Get in touch with us directly. Alternatively, email editorial-team (at) simplywallst.com.
This article by Simply Wall St is general in nature. We provide commentary based on historical data and analyst forecasts only using an unbiased methodology and our articles are not intended to be financial advice. It does not constitute a recommendation to buy or sell any stock, and does not take account of your objectives, or your financial situation. We aim to bring you long-term focused analysis driven by fundamental data. Note that our analysis may not factor in the latest price-sensitive company announcements or qualitative material. Simply Wall St has no position in any stocks mentioned.
About SZSE:300008
Bestway Marine & Energy TechnologyLtd
Provides marine and offshore engineering research and design services in China.
Excellent balance sheet with proven track record.
Market Insights

Advertisement
Community Narratives
MINISO's fair value is projected at 26.69 with an anticipated PE ratio shift of 20x
Fair Value US$24.03|9.0% undervalued
BE
Community Contributor
Procter & Gamble: A Dividend Giant Facing Slowing Growth
Fair Value US$119.81|23.5% overvalued
AN
Community Contributor
Eli Lilly's Future Growth Driven by Tirzepatide and Favorable Market Conditions
Fair Value US$1.19k|14.4% undervalued
EA
Community Contributor