
Advertisement
- China
- /
- Electrical
- /
- SZSE:002882
Does The Market Have A Low Tolerance For Jinlongyu Group Co., Ltd.'s (SZSE:002882) Mixed Fundamentals?
It is hard to get excited after looking at Jinlongyu Group's (SZSE:002882) recent performance, when its stock has declined 19% over the past three months. It is possible that the markets have ignored the company's differing financials and decided to lean-in to the negative sentiment. Long-term fundamentals are usually what drive market outcomes, so it's worth paying close attention. Specifically, we decided to study Jinlongyu Group's ROE in this article.
Return on equity or ROE is a key measure used to assess how efficiently a company's management is utilizing the company's capital. In simpler terms, it measures the profitability of a company in relation to shareholder's equity.
View our latest analysis for Jinlongyu Group
How Do You Calculate Return On Equity?
ROE can be calculated by using the formula:
Return on Equity = Net Profit (from continuing operations) ÷ Shareholders' Equity
So, based on the above formula, the ROE for Jinlongyu Group is:
10% = CN¥214m ÷ CN¥2.1b (Based on the trailing twelve months to September 2023).
The 'return' is the income the business earned over the last year. One way to conceptualize this is that for each CN¥1 of shareholders' capital it has, the company made CN¥0.10 in profit.
Why Is ROE Important For Earnings Growth?
So far, we've learned that ROE is a measure of a company's profitability. We now need to evaluate how much profit the company reinvests or "retains" for future growth which then gives us an idea about the growth potential of the company. Assuming everything else remains unchanged, the higher the ROE and profit retention, the higher the growth rate of a company compared to companies that don't necessarily bear these characteristics.
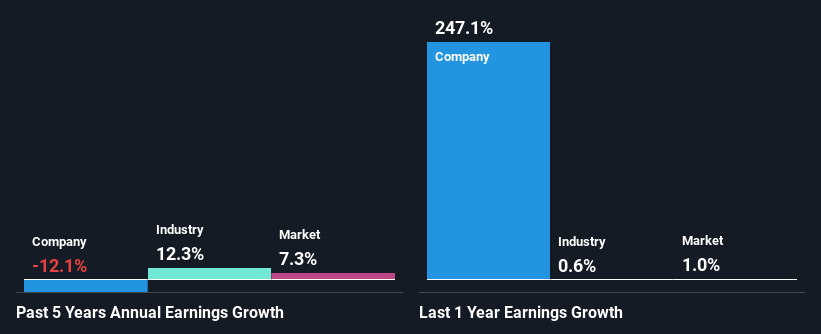
Jinlongyu Group's Earnings Growth And 10% ROE
When you first look at it, Jinlongyu Group's ROE doesn't look that attractive. However, the fact that the its ROE is quite higher to the industry average of 6.9% doesn't go unnoticed by us. However, Jinlongyu Group's five year net income decline rate was 12%. Bear in mind, the company does have a slightly low ROE. It is just that the industry ROE is lower. So that could be one of the factors that are causing earnings growth to shrink.
So, as a next step, we compared Jinlongyu Group's performance against the industry and were disappointed to discover that while the company has been shrinking its earnings, the industry has been growing its earnings at a rate of 12% over the last few years.
Earnings growth is an important metric to consider when valuing a stock. It’s important for an investor to know whether the market has priced in the company's expected earnings growth (or decline). Doing so will help them establish if the stock's future looks promising or ominous. Is Jinlongyu Group fairly valued compared to other companies? These 3 valuation measures might help you decide.
Is Jinlongyu Group Making Efficient Use Of Its Profits?
Jinlongyu Group's declining earnings is not surprising given how the company is spending most of its profits in paying dividends, judging by its three-year median payout ratio of 59% (or a retention ratio of 41%). With only very little left to reinvest into the business, growth in earnings is far from likely. You can see the 3 risks we have identified for Jinlongyu Group by visiting our risks dashboard for free on our platform here.
Additionally, Jinlongyu Group has paid dividends over a period of six years, which means that the company's management is rather focused on keeping up its dividend payments, regardless of the shrinking earnings.
Summary
On the whole, we feel that the performance shown by Jinlongyu Group can be open to many interpretations. Primarily, we are disappointed to see a lack of growth in earnings even in spite of a moderate ROE. Bear in mind, the company reinvests a small portion of its profits, which explains the lack of growth. Up till now, we've only made a short study of the company's growth data. So it may be worth checking this free detailed graph of Jinlongyu Group's past earnings, as well as revenue and cash flows to get a deeper insight into the company's performance.
New: Manage All Your Stock Portfolios in One Place
We've created the ultimate portfolio companion for stock investors, and it's free.
• Connect an unlimited number of Portfolios and see your total in one currency
• Be alerted to new Warning Signs or Risks via email or mobile
• Track the Fair Value of your stocks
Have feedback on this article? Concerned about the content? Get in touch with us directly. Alternatively, email editorial-team (at) simplywallst.com.
This article by Simply Wall St is general in nature. We provide commentary based on historical data and analyst forecasts only using an unbiased methodology and our articles are not intended to be financial advice. It does not constitute a recommendation to buy or sell any stock, and does not take account of your objectives, or your financial situation. We aim to bring you long-term focused analysis driven by fundamental data. Note that our analysis may not factor in the latest price-sensitive company announcements or qualitative material. Simply Wall St has no position in any stocks mentioned.
Have feedback on this article? Concerned about the content? Get in touch with us directly. Alternatively, email editorial-team@simplywallst.com
About SZSE:002882
Jinlongyu Group
Engages in research and development, production, sale, and service of wires and cables in China.
Adequate balance sheet with questionable track record.
Market Insights

Advertisement
Community Narratives
MicroVision will explode future revenue by 380.37% with a vision towards success
Fair Value US$60|98.4% undervalued
TH
Community Contributor
The Indispensable Artery for a New North American Economy
Fair Value CA$132.87|0.6% undervalued
TI
Community Contributor
Recently Updated Narratives
BL


BlackGoat on Alphabet ·
Alphabet: The Under-appreciated Compounder Hiding in Plain Sight
Fair Value:US$324.481.3% undervalued
76 followersusers have followed this narrative
3 commentsusers have commented on this narrative
1 likeusers have liked this narrative
BE


Bejgal on MINISO Group Holding ·
MINISO's fair value is projected at 26.69 with an anticipated PE ratio shift of 20x
Fair Value:US$26.6926.7% undervalued
45 followersusers have followed this narrative
3 commentsusers have commented on this narrative
0 likesusers have liked this narrative
TI


TickerTickle on Oracle ·
The Quiet Giant That Became AI’s Power Grid
Fair Value:US$389.8147.4% undervalued
9 followersusers have followed this narrative
1 commentusers have commented on this narrative
0 likesusers have liked this narrative
Popular Narratives
OS

oscargarcia on Alphabet ·
The company that turned a verb into a global necessity and basically runs the modern internet, digital ads, smartphones, maps, and AI.
Fair Value:US$3405.9% undervalued
136 followersusers have followed this narrative
6 commentsusers have commented on this narrative
18 likesusers have liked this narrative
TH

TheWallstreetKing on MicroVision ·
MicroVision will explode future revenue by 380.37% with a vision towards success
Fair Value:US$6098.4% undervalued
89 followersusers have followed this narrative
10 commentsusers have commented on this narrative
18 likesusers have liked this narrative
AN


AnalystConsensusTarget on NVIDIA ·
NVDA: Expanding AI Demand Will Drive Major Data Center Investments Through 2026
Fair Value:US$232.7922.6% undervalued
927 followersusers have followed this narrative
6 commentsusers have commented on this narrative
22 likesusers have liked this narrative