
Advertisement
- China
- /
- Electrical
- /
- SZSE:002823
Revenues Working Against Shenzhen Kaizhong Precision Technology Co., Ltd.'s (SZSE:002823) Share Price Following 28% Dive
The Shenzhen Kaizhong Precision Technology Co., Ltd. (SZSE:002823) share price has softened a substantial 28% over the previous 30 days, handing back much of the gains the stock has made lately. Looking at the bigger picture, even after this poor month the stock is up 25% in the last year.
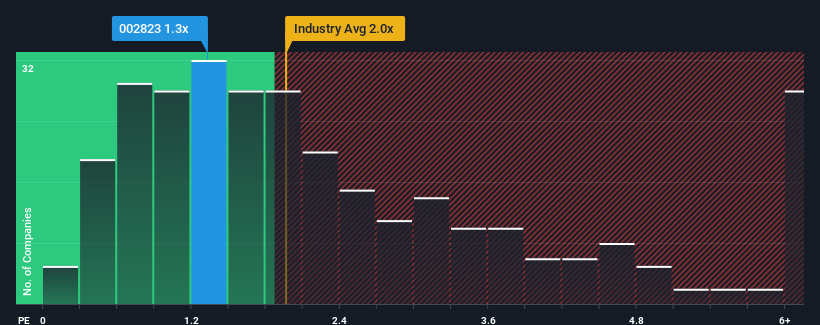
Although its price has dipped substantially, Shenzhen Kaizhong Precision Technology's price-to-sales (or "P/S") ratio of 1.3x might still make it look like a buy right now compared to the Electrical industry in China, where around half of the companies have P/S ratios above 2x and even P/S above 4x are quite common. However, the P/S might be low for a reason and it requires further investigation to determine if it's justified.
View our latest analysis for Shenzhen Kaizhong Precision Technology
What Does Shenzhen Kaizhong Precision Technology's P/S Mean For Shareholders?
Revenue has risen firmly for Shenzhen Kaizhong Precision Technology recently, which is pleasing to see. It might be that many expect the respectable revenue performance to degrade substantially, which has repressed the P/S. Those who are bullish on Shenzhen Kaizhong Precision Technology will be hoping that this isn't the case, so that they can pick up the stock at a lower valuation.
Although there are no analyst estimates available for Shenzhen Kaizhong Precision Technology, take a look at this free data-rich visualisation to see how the company stacks up on earnings, revenue and cash flow.How Is Shenzhen Kaizhong Precision Technology's Revenue Growth Trending?
The only time you'd be truly comfortable seeing a P/S as low as Shenzhen Kaizhong Precision Technology's is when the company's growth is on track to lag the industry.
Taking a look back first, we see that the company managed to grow revenues by a handy 14% last year. Pleasingly, revenue has also lifted 50% in aggregate from three years ago, partly thanks to the last 12 months of growth. Accordingly, shareholders would have definitely welcomed those medium-term rates of revenue growth.
Comparing that to the industry, which is predicted to deliver 23% growth in the next 12 months, the company's momentum is weaker, based on recent medium-term annualised revenue results.
With this information, we can see why Shenzhen Kaizhong Precision Technology is trading at a P/S lower than the industry. Apparently many shareholders weren't comfortable holding on to something they believe will continue to trail the wider industry.
What We Can Learn From Shenzhen Kaizhong Precision Technology's P/S?
The southerly movements of Shenzhen Kaizhong Precision Technology's shares means its P/S is now sitting at a pretty low level. It's argued the price-to-sales ratio is an inferior measure of value within certain industries, but it can be a powerful business sentiment indicator.
In line with expectations, Shenzhen Kaizhong Precision Technology maintains its low P/S on the weakness of its recent three-year growth being lower than the wider industry forecast. At this stage investors feel the potential for an improvement in revenue isn't great enough to justify a higher P/S ratio. Unless the recent medium-term conditions improve, they will continue to form a barrier for the share price around these levels.
Before you settle on your opinion, we've discovered 4 warning signs for Shenzhen Kaizhong Precision Technology (3 are significant!) that you should be aware of.
If these risks are making you reconsider your opinion on Shenzhen Kaizhong Precision Technology, explore our interactive list of high quality stocks to get an idea of what else is out there.
New: Manage All Your Stock Portfolios in One Place
We've created the ultimate portfolio companion for stock investors, and it's free.
• Connect an unlimited number of Portfolios and see your total in one currency
• Be alerted to new Warning Signs or Risks via email or mobile
• Track the Fair Value of your stocks
Have feedback on this article? Concerned about the content? Get in touch with us directly. Alternatively, email editorial-team (at) simplywallst.com.
This article by Simply Wall St is general in nature. We provide commentary based on historical data and analyst forecasts only using an unbiased methodology and our articles are not intended to be financial advice. It does not constitute a recommendation to buy or sell any stock, and does not take account of your objectives, or your financial situation. We aim to bring you long-term focused analysis driven by fundamental data. Note that our analysis may not factor in the latest price-sensitive company announcements or qualitative material. Simply Wall St has no position in any stocks mentioned.
About SZSE:002823
Shenzhen Kaizhong Precision Technology
Shenzhen Kaizhong Precision Technology Co., Ltd.
Solid track record with excellent balance sheet and pays a dividend.
Market Insights

Advertisement
Community Narratives
MicroVision will explode future revenue by 380.37% with a vision towards success
Fair Value US$60|98.4% undervalued
TH
Community Contributor
The Indispensable Artery for a New North American Economy
Fair Value CA$132.87|0.6% undervalued
TI
Community Contributor
Recently Updated Narratives
BL


BlackGoat on Alphabet ·
Alphabet: The Under-appreciated Compounder Hiding in Plain Sight
Fair Value:US$324.481.3% undervalued
76 followersusers have followed this narrative
3 commentsusers have commented on this narrative
1 likeusers have liked this narrative
BE


Bejgal on MINISO Group Holding ·
MINISO's fair value is projected at 26.69 with an anticipated PE ratio shift of 20x
Fair Value:US$26.6926.7% undervalued
45 followersusers have followed this narrative
3 commentsusers have commented on this narrative
0 likesusers have liked this narrative
TI


TickerTickle on Oracle ·
The Quiet Giant That Became AI’s Power Grid
Fair Value:US$389.8147.4% undervalued
9 followersusers have followed this narrative
1 commentusers have commented on this narrative
0 likesusers have liked this narrative
Popular Narratives
OS

oscargarcia on Alphabet ·
The company that turned a verb into a global necessity and basically runs the modern internet, digital ads, smartphones, maps, and AI.
Fair Value:US$3405.9% undervalued
136 followersusers have followed this narrative
6 commentsusers have commented on this narrative
18 likesusers have liked this narrative
TH

TheWallstreetKing on MicroVision ·
MicroVision will explode future revenue by 380.37% with a vision towards success
Fair Value:US$6098.4% undervalued
89 followersusers have followed this narrative
10 commentsusers have commented on this narrative
18 likesusers have liked this narrative
AN


AnalystConsensusTarget on NVIDIA ·
NVDA: Expanding AI Demand Will Drive Major Data Center Investments Through 2026
Fair Value:US$232.7922.6% undervalued
927 followersusers have followed this narrative
6 commentsusers have commented on this narrative
22 likesusers have liked this narrative