
Advertisement
Sichuan Crun Co., Ltd's (SZSE:002272) Shares Climb 31% But Its Business Is Yet to Catch Up
Sichuan Crun Co., Ltd (SZSE:002272) shareholders are no doubt pleased to see that the share price has bounced 31% in the last month, although it is still struggling to make up recently lost ground. The annual gain comes to 140% following the latest surge, making investors sit up and take notice.
Even after such a large jump in price, you could still be forgiven for feeling indifferent about Sichuan Crun's P/S ratio of 3.3x, since the median price-to-sales (or "P/S") ratio for the Machinery industry in China is about the same. However, investors might be overlooking a clear opportunity or potential setback if there is no rational basis for the P/S.
Check out our latest analysis for Sichuan Crun
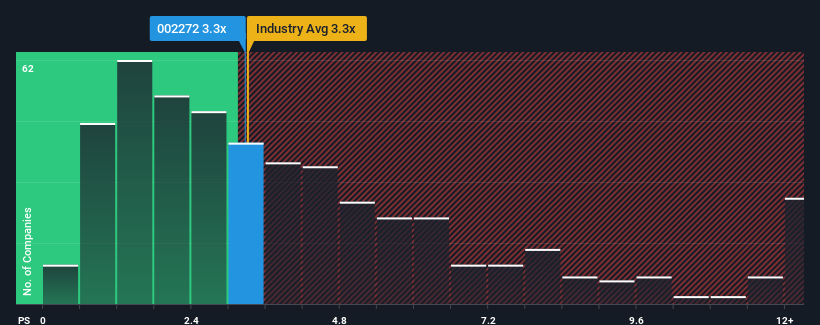
What Does Sichuan Crun's P/S Mean For Shareholders?
For example, consider that Sichuan Crun's financial performance has been poor lately as its revenue has been in decline. Perhaps investors believe the recent revenue performance is enough to keep in line with the industry, which is keeping the P/S from dropping off. If not, then existing shareholders may be a little nervous about the viability of the share price.
Want the full picture on earnings, revenue and cash flow for the company? Then our free report on Sichuan Crun will help you shine a light on its historical performance.What Are Revenue Growth Metrics Telling Us About The P/S?
The only time you'd be comfortable seeing a P/S like Sichuan Crun's is when the company's growth is tracking the industry closely.
Taking a look back first, the company's revenue growth last year wasn't something to get excited about as it posted a disappointing decline of 12%. Regardless, revenue has managed to lift by a handy 9.2% in aggregate from three years ago, thanks to the earlier period of growth. Accordingly, while they would have preferred to keep the run going, shareholders would be roughly satisfied with the medium-term rates of revenue growth.
Comparing the recent medium-term revenue trends against the industry's one-year growth forecast of 22% shows it's noticeably less attractive.
In light of this, it's curious that Sichuan Crun's P/S sits in line with the majority of other companies. It seems most investors are ignoring the fairly limited recent growth rates and are willing to pay up for exposure to the stock. They may be setting themselves up for future disappointment if the P/S falls to levels more in line with recent growth rates.
The Final Word
Its shares have lifted substantially and now Sichuan Crun's P/S is back within range of the industry median. Typically, we'd caution against reading too much into price-to-sales ratios when settling on investment decisions, though it can reveal plenty about what other market participants think about the company.
We've established that Sichuan Crun's average P/S is a bit surprising since its recent three-year growth is lower than the wider industry forecast. Right now we are uncomfortable with the P/S as this revenue performance isn't likely to support a more positive sentiment for long. Unless the recent medium-term conditions improve, it's hard to accept the current share price as fair value.
It's always necessary to consider the ever-present spectre of investment risk. We've identified 2 warning signs with Sichuan Crun, and understanding these should be part of your investment process.
Of course, profitable companies with a history of great earnings growth are generally safer bets. So you may wish to see this free collection of other companies that have reasonable P/E ratios and have grown earnings strongly.
New: Manage All Your Stock Portfolios in One Place
We've created the ultimate portfolio companion for stock investors, and it's free.
• Connect an unlimited number of Portfolios and see your total in one currency
• Be alerted to new Warning Signs or Risks via email or mobile
• Track the Fair Value of your stocks
Have feedback on this article? Concerned about the content? Get in touch with us directly. Alternatively, email editorial-team (at) simplywallst.com.
This article by Simply Wall St is general in nature. We provide commentary based on historical data and analyst forecasts only using an unbiased methodology and our articles are not intended to be financial advice. It does not constitute a recommendation to buy or sell any stock, and does not take account of your objectives, or your financial situation. We aim to bring you long-term focused analysis driven by fundamental data. Note that our analysis may not factor in the latest price-sensitive company announcements or qualitative material. Simply Wall St has no position in any stocks mentioned.
About SZSE:002272
Sichuan Crun
Manufactures and sells high-end equipment in the People's Republic of China.
Low risk with imperfect balance sheet.
Market Insights

Advertisement
Community Narratives
MINISO's fair value is projected at 26.69 with an anticipated PE ratio shift of 20x
Fair Value US$24.03|11.4% undervalued
BE
Community Contributor
Procter & Gamble: A Dividend Giant Facing Slowing Growth
Fair Value US$119.81|23.5% overvalued
AN
Community Contributor
Eli Lilly's Future Growth Driven by Tirzepatide and Favorable Market Conditions
Fair Value US$1.19k|14.0% undervalued
EA
Community Contributor