China Fangda Group's (SZSE:000055 five-year decrease in earnings delivers investors with a 28% loss


The main aim of stock picking is to find the market-beating stocks. But even the best stock picker will only win with some selections. So we wouldn't blame long term China Fangda Group Co., Ltd. (SZSE:000055) shareholders for doubting their decision to hold, with the stock down 32% over a half decade. And we doubt long term believers are the only worried holders, since the stock price has declined 25% over the last twelve months. Even worse, it's down 15% in about a month, which isn't fun at all.
Given the past week has been tough on shareholders, let's investigate the fundamentals and see what we can learn.
See our latest analysis for China Fangda Group
There is no denying that markets are sometimes efficient, but prices do not always reflect underlying business performance. One way to examine how market sentiment has changed over time is to look at the interaction between a company's share price and its earnings per share (EPS).
Looking back five years, both China Fangda Group's share price and EPS declined; the latter at a rate of 34% per year. The share price decline of 7% per year isn't as bad as the EPS decline. So the market may previously have expected a drop, or else it expects the situation will improve.
The company's earnings per share (over time) is depicted in the image below (click to see the exact numbers).
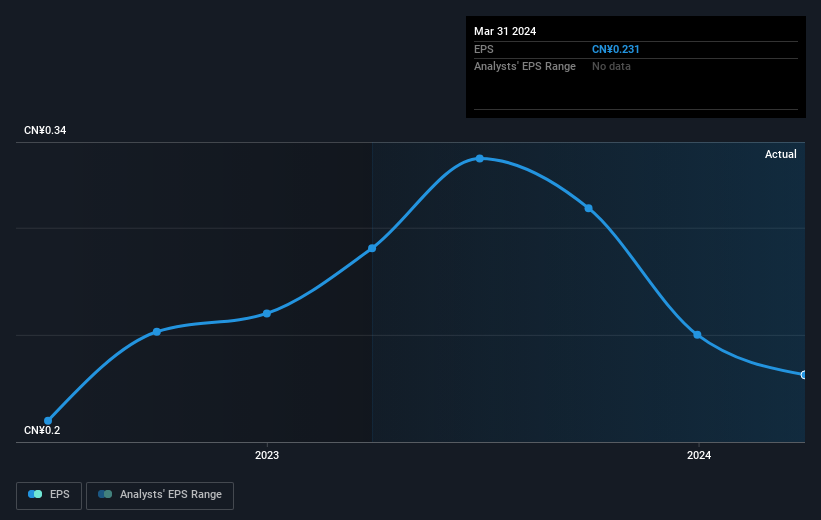
This free interactive report on China Fangda Group's earnings, revenue and cash flow is a great place to start, if you want to investigate the stock further.
What About Dividends?
It is important to consider the total shareholder return, as well as the share price return, for any given stock. The TSR is a return calculation that accounts for the value of cash dividends (assuming that any dividend received was reinvested) and the calculated value of any discounted capital raisings and spin-offs. So for companies that pay a generous dividend, the TSR is often a lot higher than the share price return. As it happens, China Fangda Group's TSR for the last 5 years was -28%, which exceeds the share price return mentioned earlier. The dividends paid by the company have thusly boosted the total shareholder return.
A Different Perspective
We regret to report that China Fangda Group shareholders are down 24% for the year (even including dividends). Unfortunately, that's worse than the broader market decline of 10%. However, it could simply be that the share price has been impacted by broader market jitters. It might be worth keeping an eye on the fundamentals, in case there's a good opportunity. Regrettably, last year's performance caps off a bad run, with the shareholders facing a total loss of 5% per year over five years. Generally speaking long term share price weakness can be a bad sign, though contrarian investors might want to research the stock in hope of a turnaround. It's always interesting to track share price performance over the longer term. But to understand China Fangda Group better, we need to consider many other factors. Like risks, for instance. Every company has them, and we've spotted 2 warning signs for China Fangda Group (of which 1 is concerning!) you should know about.
If you like to buy stocks alongside management, then you might just love this free list of companies. (Hint: many of them are unnoticed AND have attractive valuation).
Please note, the market returns quoted in this article reflect the market weighted average returns of stocks that currently trade on Chinese exchanges.
New: AI Stock Screener & Alerts
Our new AI Stock Screener scans the market every day to uncover opportunities.
• Dividend Powerhouses (3%+ Yield)
• Undervalued Small Caps with Insider Buying
• High growth Tech and AI Companies
Or build your own from over 50 metrics.
Have feedback on this article? Concerned about the content? Get in touch with us directly. Alternatively, email editorial-team (at) simplywallst.com.
This article by Simply Wall St is general in nature. We provide commentary based on historical data and analyst forecasts only using an unbiased methodology and our articles are not intended to be financial advice. It does not constitute a recommendation to buy or sell any stock, and does not take account of your objectives, or your financial situation. We aim to bring you long-term focused analysis driven by fundamental data. Note that our analysis may not factor in the latest price-sensitive company announcements or qualitative material. Simply Wall St has no position in any stocks mentioned.
About SZSE:000055
China Fangda Group
Manufactures and sells curtain wall materials in China and internationally.
Adequate balance sheet second-rate dividend payer.
