
Advertisement
Further Upside For Suzhou Harmontronics Automation Technology Co., Ltd (SHSE:688022) Shares Could Introduce Price Risks After 31% Bounce

Suzhou Harmontronics Automation Technology Co., Ltd (SHSE:688022) shareholders are no doubt pleased to see that the share price has bounced 31% in the last month, although it is still struggling to make up recently lost ground. Still, the 30-day jump doesn't change the fact that longer term shareholders have seen their stock decimated by the 67% share price drop in the last twelve months.
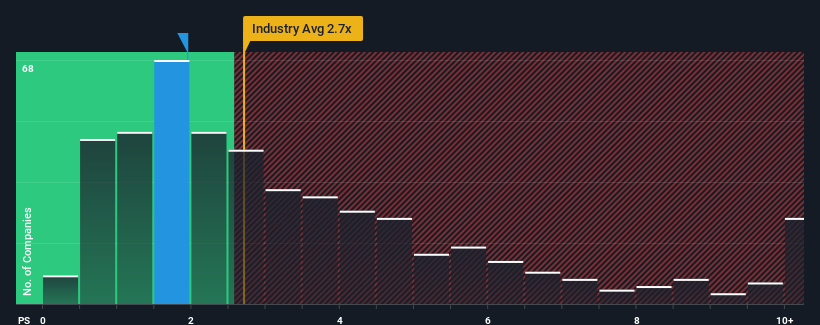
Even after such a large jump in price, Suzhou Harmontronics Automation Technology may still be sending bullish signals at the moment with its price-to-sales (or "P/S") ratio of 1.9x, since almost half of all companies in the Machinery industry in China have P/S ratios greater than 2.7x and even P/S higher than 5x are not unusual. Nonetheless, we'd need to dig a little deeper to determine if there is a rational basis for the reduced P/S.
Check out our latest analysis for Suzhou Harmontronics Automation Technology
What Does Suzhou Harmontronics Automation Technology's P/S Mean For Shareholders?
Suzhou Harmontronics Automation Technology certainly has been doing a good job lately as it's been growing revenue more than most other companies. One possibility is that the P/S ratio is low because investors think this strong revenue performance might be less impressive moving forward. If you like the company, you'd be hoping this isn't the case so that you could potentially pick up some stock while it's out of favour.
If you'd like to see what analysts are forecasting going forward, you should check out our free report on Suzhou Harmontronics Automation Technology.What Are Revenue Growth Metrics Telling Us About The Low P/S?
There's an inherent assumption that a company should underperform the industry for P/S ratios like Suzhou Harmontronics Automation Technology's to be considered reasonable.
If we review the last year of revenue growth, the company posted a terrific increase of 20%. Pleasingly, revenue has also lifted 127% in aggregate from three years ago, thanks to the last 12 months of growth. Therefore, it's fair to say the revenue growth recently has been superb for the company.
Turning to the outlook, the next year should generate growth of 56% as estimated by the sole analyst watching the company. With the industry only predicted to deliver 27%, the company is positioned for a stronger revenue result.
With this information, we find it odd that Suzhou Harmontronics Automation Technology is trading at a P/S lower than the industry. It looks like most investors are not convinced at all that the company can achieve future growth expectations.
What We Can Learn From Suzhou Harmontronics Automation Technology's P/S?
The latest share price surge wasn't enough to lift Suzhou Harmontronics Automation Technology's P/S close to the industry median. Generally, our preference is to limit the use of the price-to-sales ratio to establishing what the market thinks about the overall health of a company.
A look at Suzhou Harmontronics Automation Technology's revenues reveals that, despite glowing future growth forecasts, its P/S is much lower than we'd expect. The reason for this depressed P/S could potentially be found in the risks the market is pricing in. At least price risks look to be very low, but investors seem to think future revenues could see a lot of volatility.
Having said that, be aware Suzhou Harmontronics Automation Technology is showing 1 warning sign in our investment analysis, you should know about.
If strong companies turning a profit tickle your fancy, then you'll want to check out this free list of interesting companies that trade on a low P/E (but have proven they can grow earnings).
New: Manage All Your Stock Portfolios in One Place
We've created the ultimate portfolio companion for stock investors, and it's free.
• Connect an unlimited number of Portfolios and see your total in one currency
• Be alerted to new Warning Signs or Risks via email or mobile
• Track the Fair Value of your stocks
Have feedback on this article? Concerned about the content? Get in touch with us directly. Alternatively, email editorial-team (at) simplywallst.com.
This article by Simply Wall St is general in nature. We provide commentary based on historical data and analyst forecasts only using an unbiased methodology and our articles are not intended to be financial advice. It does not constitute a recommendation to buy or sell any stock, and does not take account of your objectives, or your financial situation. We aim to bring you long-term focused analysis driven by fundamental data. Note that our analysis may not factor in the latest price-sensitive company announcements or qualitative material. Simply Wall St has no position in any stocks mentioned.
About SHSE:688022
Suzhou Harmontronics Automation Technology
Engages in the research, design, development, sale, and servicing of intelligent manufacturing equipment and systems in China.
Very low with worrying balance sheet.
Market Insights


Advertisement
Community Narratives
Alphabet: The Under-appreciated Compounder Hiding in Plain Sight
Fair Value US$282.83|31.8% undervalued
BL
Community Contributor
Planet Labs: At The Heart Of The Emerging New Space Boom
Fair Value US$11.31|44.7% undervalued
AN
Community Contributor
Exxon in Guyana 5 year forecast Low $135 to High $189
Fair Value US$174.00|35.8% undervalued
AG
Community Contributor