Stock Analysis
Declining Stock and Solid Fundamentals: Is The Market Wrong About Yindu Kitchen Equipment Co., Ltd (SHSE:603277)?


With its stock down 12% over the past month, it is easy to disregard Yindu Kitchen Equipment (SHSE:603277). However, a closer look at its sound financials might cause you to think again. Given that fundamentals usually drive long-term market outcomes, the company is worth looking at. In this article, we decided to focus on Yindu Kitchen Equipment's ROE.
Return on Equity or ROE is a test of how effectively a company is growing its value and managing investors’ money. In short, ROE shows the profit each dollar generates with respect to its shareholder investments.
See our latest analysis for Yindu Kitchen Equipment
How To Calculate Return On Equity?
ROE can be calculated by using the formula:
Return on Equity = Net Profit (from continuing operations) ÷ Shareholders' Equity
So, based on the above formula, the ROE for Yindu Kitchen Equipment is:
20% = CN¥578m ÷ CN¥3.0b (Based on the trailing twelve months to March 2024).
The 'return' is the profit over the last twelve months. Another way to think of that is that for every CN¥1 worth of equity, the company was able to earn CN¥0.20 in profit.
What Has ROE Got To Do With Earnings Growth?
Thus far, we have learned that ROE measures how efficiently a company is generating its profits. Depending on how much of these profits the company reinvests or "retains", and how effectively it does so, we are then able to assess a company’s earnings growth potential. Generally speaking, other things being equal, firms with a high return on equity and profit retention, have a higher growth rate than firms that don’t share these attributes.
A Side By Side comparison of Yindu Kitchen Equipment's Earnings Growth And 20% ROE
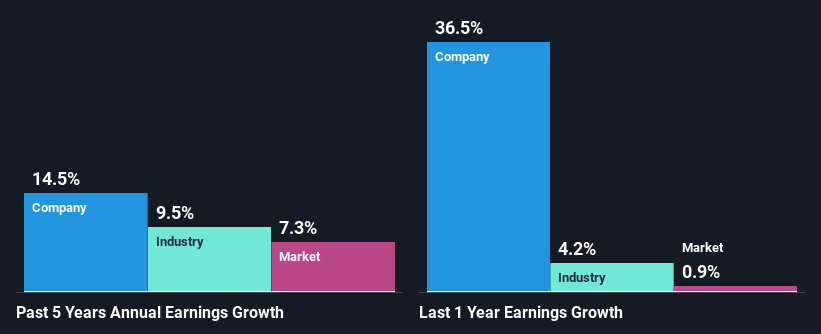
To start with, Yindu Kitchen Equipment's ROE looks acceptable. On comparing with the average industry ROE of 6.9% the company's ROE looks pretty remarkable. This certainly adds some context to Yindu Kitchen Equipment's decent 15% net income growth seen over the past five years.
Next, on comparing with the industry net income growth, we found that Yindu Kitchen Equipment's growth is quite high when compared to the industry average growth of 9.5% in the same period, which is great to see.
Earnings growth is an important metric to consider when valuing a stock. It’s important for an investor to know whether the market has priced in the company's expected earnings growth (or decline). Doing so will help them establish if the stock's future looks promising or ominous. Is Yindu Kitchen Equipment fairly valued compared to other companies? These 3 valuation measures might help you decide.
Is Yindu Kitchen Equipment Using Its Retained Earnings Effectively?
While Yindu Kitchen Equipment has a three-year median payout ratio of 82% (which means it retains 18% of profits), the company has still seen a fair bit of earnings growth in the past, meaning that its high payout ratio hasn't hampered its ability to grow.
Additionally, Yindu Kitchen Equipment has paid dividends over a period of six years which means that the company is pretty serious about sharing its profits with shareholders.
Summary
Overall, we are quite pleased with Yindu Kitchen Equipment's performance. Especially the high ROE, Which has contributed to the impressive growth seen in earnings. Despite the company reinvesting only a small portion of its profits, it still has managed to grow its earnings so that is appreciable. With that said, the latest industry analyst forecasts reveal that the company's earnings are expected to accelerate. Are these analysts expectations based on the broad expectations for the industry, or on the company's fundamentals? Click here to be taken to our analyst's forecasts page for the company.
New: Manage All Your Stock Portfolios in One Place
We've created the ultimate portfolio companion for stock investors, and it's free.
• Connect an unlimited number of Portfolios and see your total in one currency
• Be alerted to new Warning Signs or Risks via email or mobile
• Track the Fair Value of your stocks
Have feedback on this article? Concerned about the content? Get in touch with us directly. Alternatively, email editorial-team (at) simplywallst.com.
This article by Simply Wall St is general in nature. We provide commentary based on historical data and analyst forecasts only using an unbiased methodology and our articles are not intended to be financial advice. It does not constitute a recommendation to buy or sell any stock, and does not take account of your objectives, or your financial situation. We aim to bring you long-term focused analysis driven by fundamental data. Note that our analysis may not factor in the latest price-sensitive company announcements or qualitative material. Simply Wall St has no position in any stocks mentioned.
Have feedback on this article? Concerned about the content? Get in touch with us directly. Alternatively, email editorial-team@simplywallst.com
About SHSE:603277
Yindu Kitchen Equipment
Engages in the research, development, production, and sale of commercial catering equipment in China and Internationally.
Solid track record with excellent balance sheet.
