Stock Analysis
- China
- /
- Construction
- /
- SHSE:600970
Sinoma International EngineeringLtd's (SHSE:600970) earnings growth rate lags the 12% CAGR delivered to shareholders


Sinoma International Engineering Co.,Ltd (SHSE:600970) shareholders might be concerned after seeing the share price drop 23% in the last quarter. But that doesn't change the fact that the returns over the last five years have been pleasing. Its return of 52% has certainly bested the market return!
While this past week has detracted from the company's five-year return, let's look at the recent trends of the underlying business and see if the gains have been in alignment.
Check out our latest analysis for Sinoma International EngineeringLtd
While the efficient markets hypothesis continues to be taught by some, it has been proven that markets are over-reactive dynamic systems, and investors are not always rational. One way to examine how market sentiment has changed over time is to look at the interaction between a company's share price and its earnings per share (EPS).
During five years of share price growth, Sinoma International EngineeringLtd achieved compound earnings per share (EPS) growth of 6.5% per year. This EPS growth is slower than the share price growth of 9% per year, over the same period. So it's fair to assume the market has a higher opinion of the business than it did five years ago. That's not necessarily surprising considering the five-year track record of earnings growth.
The company's earnings per share (over time) is depicted in the image below (click to see the exact numbers).
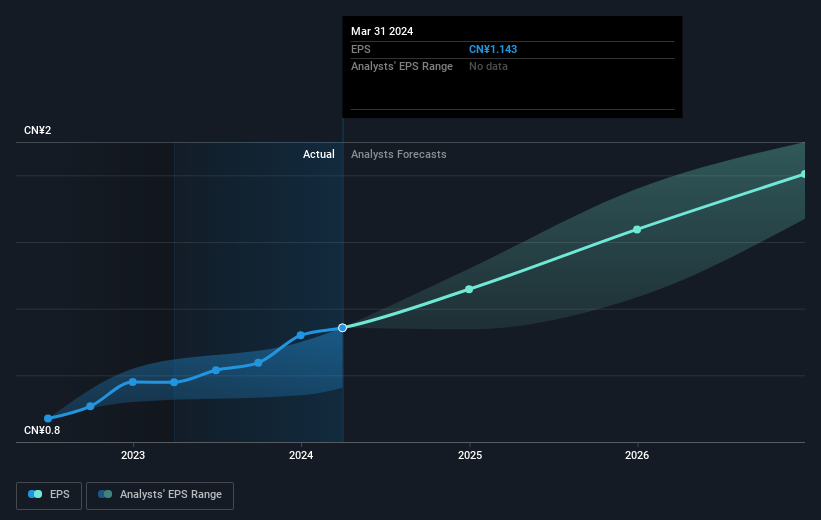
We know that Sinoma International EngineeringLtd has improved its bottom line lately, but is it going to grow revenue? You could check out this free report showing analyst revenue forecasts.
What About Dividends?
As well as measuring the share price return, investors should also consider the total shareholder return (TSR). The TSR incorporates the value of any spin-offs or discounted capital raisings, along with any dividends, based on the assumption that the dividends are reinvested. So for companies that pay a generous dividend, the TSR is often a lot higher than the share price return. We note that for Sinoma International EngineeringLtd the TSR over the last 5 years was 78%, which is better than the share price return mentioned above. The dividends paid by the company have thusly boosted the total shareholder return.
A Different Perspective
We regret to report that Sinoma International EngineeringLtd shareholders are down 26% for the year (even including dividends). Unfortunately, that's worse than the broader market decline of 19%. Having said that, it's inevitable that some stocks will be oversold in a falling market. The key is to keep your eyes on the fundamental developments. Longer term investors wouldn't be so upset, since they would have made 12%, each year, over five years. If the fundamental data continues to indicate long term sustainable growth, the current sell-off could be an opportunity worth considering. It's always interesting to track share price performance over the longer term. But to understand Sinoma International EngineeringLtd better, we need to consider many other factors. Consider risks, for instance. Every company has them, and we've spotted 1 warning sign for Sinoma International EngineeringLtd you should know about.
If you would prefer to check out another company -- one with potentially superior financials -- then do not miss this free list of companies that have proven they can grow earnings.
Please note, the market returns quoted in this article reflect the market weighted average returns of stocks that currently trade on Chinese exchanges.
New: Manage All Your Stock Portfolios in One Place
We've created the ultimate portfolio companion for stock investors, and it's free.
• Connect an unlimited number of Portfolios and see your total in one currency
• Be alerted to new Warning Signs or Risks via email or mobile
• Track the Fair Value of your stocks
Have feedback on this article? Concerned about the content? Get in touch with us directly. Alternatively, email editorial-team (at) simplywallst.com.
This article by Simply Wall St is general in nature. We provide commentary based on historical data and analyst forecasts only using an unbiased methodology and our articles are not intended to be financial advice. It does not constitute a recommendation to buy or sell any stock, and does not take account of your objectives, or your financial situation. We aim to bring you long-term focused analysis driven by fundamental data. Note that our analysis may not factor in the latest price-sensitive company announcements or qualitative material. Simply Wall St has no position in any stocks mentioned.
Have feedback on this article? Concerned about the content? Get in touch with us directly. Alternatively, email editorial-team@simplywallst.com
About SHSE:600970
Sinoma International EngineeringLtd
Engages in the engineering, equipment manufacture and supply, and other businesses in China and internationally.
Very undervalued with flawless balance sheet and pays a dividend.
