- China
- /
- Trade Distributors
- /
- SHSE:600546
Investing in Shanxi Coal International Energy GroupLtd (SHSE:600546) five years ago would have delivered you a 169% gain


When you buy a stock there is always a possibility that it could drop 100%. But when you pick a company that is really flourishing, you can make more than 100%. Long term Shanxi Coal International Energy Group Co.,Ltd (SHSE:600546) shareholders would be well aware of this, since the stock is up 104% in five years. In the last week the share price is up 1.8%.
Now it's worth having a look at the company's fundamentals too, because that will help us determine if the long term shareholder return has matched the performance of the underlying business.
View our latest analysis for Shanxi Coal International Energy GroupLtd
While the efficient markets hypothesis continues to be taught by some, it has been proven that markets are over-reactive dynamic systems, and investors are not always rational. One way to examine how market sentiment has changed over time is to look at the interaction between a company's share price and its earnings per share (EPS).
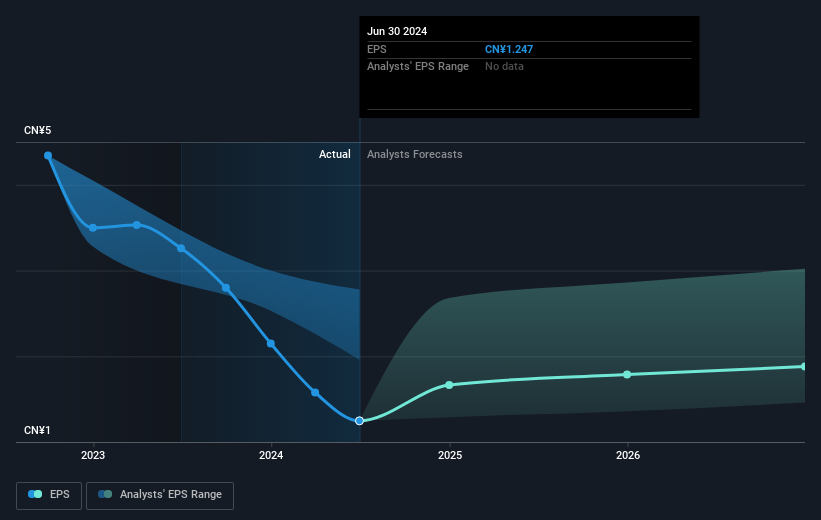
During five years of share price growth, Shanxi Coal International Energy GroupLtd achieved compound earnings per share (EPS) growth of 45% per year. This EPS growth is higher than the 15% average annual increase in the share price. Therefore, it seems the market has become relatively pessimistic about the company. This cautious sentiment is reflected in its (fairly low) P/E ratio of 10.54.
You can see below how EPS has changed over time (discover the exact values by clicking on the image).
This free interactive report on Shanxi Coal International Energy GroupLtd's earnings, revenue and cash flow is a great place to start, if you want to investigate the stock further.
What About Dividends?
When looking at investment returns, it is important to consider the difference between total shareholder return (TSR) and share price return. The TSR is a return calculation that accounts for the value of cash dividends (assuming that any dividend received was reinvested) and the calculated value of any discounted capital raisings and spin-offs. Arguably, the TSR gives a more comprehensive picture of the return generated by a stock. We note that for Shanxi Coal International Energy GroupLtd the TSR over the last 5 years was 169%, which is better than the share price return mentioned above. The dividends paid by the company have thusly boosted the total shareholder return.
A Different Perspective
Shanxi Coal International Energy GroupLtd shareholders are down 18% for the year (even including dividends), but the market itself is up 8.8%. However, keep in mind that even the best stocks will sometimes underperform the market over a twelve month period. Longer term investors wouldn't be so upset, since they would have made 22%, each year, over five years. If the fundamental data continues to indicate long term sustainable growth, the current sell-off could be an opportunity worth considering. While it is well worth considering the different impacts that market conditions can have on the share price, there are other factors that are even more important. Take risks, for example - Shanxi Coal International Energy GroupLtd has 2 warning signs we think you should be aware of.
If you like to buy stocks alongside management, then you might just love this free list of companies. (Hint: many of them are unnoticed AND have attractive valuation).
Please note, the market returns quoted in this article reflect the market weighted average returns of stocks that currently trade on Chinese exchanges.
New: Manage All Your Stock Portfolios in One Place
We've created the ultimate portfolio companion for stock investors, and it's free.
• Connect an unlimited number of Portfolios and see your total in one currency
• Be alerted to new Warning Signs or Risks via email or mobile
• Track the Fair Value of your stocks
Have feedback on this article? Concerned about the content? Get in touch with us directly. Alternatively, email editorial-team (at) simplywallst.com.
This article by Simply Wall St is general in nature. We provide commentary based on historical data and analyst forecasts only using an unbiased methodology and our articles are not intended to be financial advice. It does not constitute a recommendation to buy or sell any stock, and does not take account of your objectives, or your financial situation. We aim to bring you long-term focused analysis driven by fundamental data. Note that our analysis may not factor in the latest price-sensitive company announcements or qualitative material. Simply Wall St has no position in any stocks mentioned.
About SHSE:600546
Shanxi Coal International Energy GroupLtd
Engages in the coal production business in China and internationally.
Flawless balance sheet established dividend payer.
