
Advertisement
- China
- /
- Auto Components
- /
- SZSE:300375
Is Tianjin Pengling Group Co.,Ltd's (SZSE:300375) Recent Performance Underpinned By Weak Financials?
With its stock down 19% over the past month, it is easy to disregard Tianjin Pengling GroupLtd (SZSE:300375). To decide if this trend could continue, we decided to look at its weak fundamentals as they shape the long-term market trends. In this article, we decided to focus on Tianjin Pengling GroupLtd's ROE.
Return on equity or ROE is an important factor to be considered by a shareholder because it tells them how effectively their capital is being reinvested. In other words, it is a profitability ratio which measures the rate of return on the capital provided by the company's shareholders.
View our latest analysis for Tianjin Pengling GroupLtd
How Is ROE Calculated?
The formula for ROE is:
Return on Equity = Net Profit (from continuing operations) ÷ Shareholders' Equity
So, based on the above formula, the ROE for Tianjin Pengling GroupLtd is:
1.8% = CN¥41m ÷ CN¥2.2b (Based on the trailing twelve months to March 2024).
The 'return' is the yearly profit. Another way to think of that is that for every CN¥1 worth of equity, the company was able to earn CN¥0.02 in profit.
What Has ROE Got To Do With Earnings Growth?
So far, we've learned that ROE is a measure of a company's profitability. Depending on how much of these profits the company reinvests or "retains", and how effectively it does so, we are then able to assess a company’s earnings growth potential. Generally speaking, other things being equal, firms with a high return on equity and profit retention, have a higher growth rate than firms that don’t share these attributes.
A Side By Side comparison of Tianjin Pengling GroupLtd's Earnings Growth And 1.8% ROE
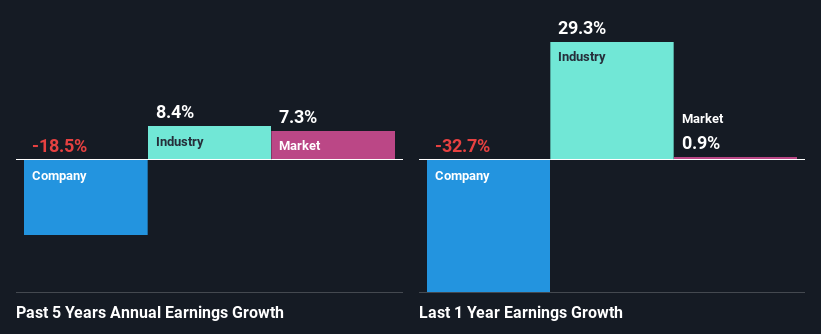
As you can see, Tianjin Pengling GroupLtd's ROE looks pretty weak. Even when compared to the industry average of 8.1%, the ROE figure is pretty disappointing. Given the circumstances, the significant decline in net income by 18% seen by Tianjin Pengling GroupLtd over the last five years is not surprising. However, there could also be other factors causing the earnings to decline. Such as - low earnings retention or poor allocation of capital.
So, as a next step, we compared Tianjin Pengling GroupLtd's performance against the industry and were disappointed to discover that while the company has been shrinking its earnings, the industry has been growing its earnings at a rate of 8.4% over the last few years.
The basis for attaching value to a company is, to a great extent, tied to its earnings growth. What investors need to determine next is if the expected earnings growth, or the lack of it, is already built into the share price. Doing so will help them establish if the stock's future looks promising or ominous. If you're wondering about Tianjin Pengling GroupLtd's's valuation, check out this gauge of its price-to-earnings ratio, as compared to its industry.
Is Tianjin Pengling GroupLtd Using Its Retained Earnings Effectively?
With a high three-year median payout ratio of 59% (implying that 41% of the profits are retained), most of Tianjin Pengling GroupLtd's profits are being paid to shareholders, which explains the company's shrinking earnings. With only a little being reinvested into the business, earnings growth would obviously be low or non-existent. To know the 5 risks we have identified for Tianjin Pengling GroupLtd visit our risks dashboard for free.
In addition, Tianjin Pengling GroupLtd has been paying dividends over a period of at least ten years suggesting that keeping up dividend payments is way more important to the management even if it comes at the cost of business growth.
Summary
In total, we would have a hard think before deciding on any investment action concerning Tianjin Pengling GroupLtd. Because the company is not reinvesting much into the business, and given the low ROE, it's not surprising to see the lack or absence of growth in its earnings. So far, we've only made a quick discussion around the company's earnings growth. To gain further insights into Tianjin Pengling GroupLtd's past profit growth, check out this visualization of past earnings, revenue and cash flows.
Valuation is complex, but we're here to simplify it.
Discover if Tianjin Pengling GroupLtd might be undervalued or overvalued with our detailed analysis, featuring fair value estimates, potential risks, dividends, insider trades, and its financial condition.
Access Free AnalysisHave feedback on this article? Concerned about the content? Get in touch with us directly. Alternatively, email editorial-team (at) simplywallst.com.
This article by Simply Wall St is general in nature. We provide commentary based on historical data and analyst forecasts only using an unbiased methodology and our articles are not intended to be financial advice. It does not constitute a recommendation to buy or sell any stock, and does not take account of your objectives, or your financial situation. We aim to bring you long-term focused analysis driven by fundamental data. Note that our analysis may not factor in the latest price-sensitive company announcements or qualitative material. Simply Wall St has no position in any stocks mentioned.
About SZSE:300375
Tianjin Pengling GroupLtd
Engages in the research, development, and manufacture of automotive fluid pipelines and sealing parts in China and internationally.
Adequate balance sheet with questionable track record.
Market Insights

Advertisement
Community Narratives
MINISO's fair value is projected at 26.69 with an anticipated PE ratio shift of 20x
Fair Value US$24.03|11.0% undervalued
BE
Community Contributor
Procter & Gamble: A Dividend Giant Facing Slowing Growth
Fair Value US$119.81|23.3% overvalued
AN
Community Contributor
Eli Lilly's Future Growth Driven by Tirzepatide and Favorable Market Conditions
Fair Value US$1.19k|13.8% undervalued
EA
Community Contributor