
Advertisement
- China
- /
- Auto Components
- /
- SZSE:002537
The Returns On Capital At HyUnion HoldingLtd (SZSE:002537) Don't Inspire Confidence
To avoid investing in a business that's in decline, there's a few financial metrics that can provide early indications of aging. When we see a declining return on capital employed (ROCE) in conjunction with a declining base of capital employed, that's often how a mature business shows signs of aging. This indicates the company is producing less profit from its investments and its total assets are decreasing. And from a first read, things don't look too good at HyUnion HoldingLtd (SZSE:002537), so let's see why.
Understanding Return On Capital Employed (ROCE)
Just to clarify if you're unsure, ROCE is a metric for evaluating how much pre-tax income (in percentage terms) a company earns on the capital invested in its business. Analysts use this formula to calculate it for HyUnion HoldingLtd:
Return on Capital Employed = Earnings Before Interest and Tax (EBIT) ÷ (Total Assets - Current Liabilities)
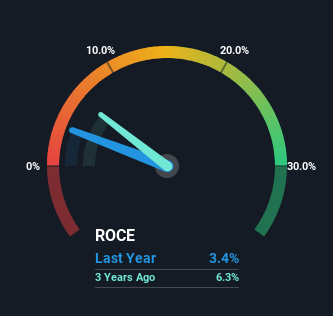
0.034 = CN¥171m ÷ (CN¥9.3b - CN¥4.3b) (Based on the trailing twelve months to March 2024).
Therefore, HyUnion HoldingLtd has an ROCE of 3.4%. In absolute terms, that's a low return and it also under-performs the Auto Components industry average of 6.9%.
Check out our latest analysis for HyUnion HoldingLtd
While the past is not representative of the future, it can be helpful to know how a company has performed historically, which is why we have this chart above. If you'd like to look at how HyUnion HoldingLtd has performed in the past in other metrics, you can view this free graph of HyUnion HoldingLtd's past earnings, revenue and cash flow.
The Trend Of ROCE
In terms of HyUnion HoldingLtd's historical ROCE trend, it isn't fantastic. The company used to generate 6.5% on its capital five years ago but it has since fallen noticeably. In addition to that, HyUnion HoldingLtd is now employing 28% less capital than it was five years ago. When you see both ROCE and capital employed diminishing, it can often be a sign of a mature and shrinking business that might be in structural decline. Typically businesses that exhibit these characteristics aren't the ones that tend to multiply over the long term, because statistically speaking, they've already gone through the growth phase of their life cycle.
On a side note, HyUnion HoldingLtd's current liabilities have increased over the last five years to 46% of total assets, effectively distorting the ROCE to some degree. Without this increase, it's likely that ROCE would be even lower than 3.4%. What this means is that in reality, a rather large portion of the business is being funded by the likes of the company's suppliers or short-term creditors, which can bring some risks of its own.
What We Can Learn From HyUnion HoldingLtd's ROCE
To see HyUnion HoldingLtd reducing the capital employed in the business in tandem with diminishing returns, is concerning. Long term shareholders who've owned the stock over the last five years have experienced a 27% depreciation in their investment, so it appears the market might not like these trends either. Unless there is a shift to a more positive trajectory in these metrics, we would look elsewhere.
HyUnion HoldingLtd does have some risks though, and we've spotted 1 warning sign for HyUnion HoldingLtd that you might be interested in.
While HyUnion HoldingLtd isn't earning the highest return, check out this free list of companies that are earning high returns on equity with solid balance sheets.
Valuation is complex, but we're here to simplify it.
Discover if HyUnion HoldingLtd might be undervalued or overvalued with our detailed analysis, featuring fair value estimates, potential risks, dividends, insider trades, and its financial condition.
Access Free AnalysisHave feedback on this article? Concerned about the content? Get in touch with us directly. Alternatively, email editorial-team (at) simplywallst.com.
This article by Simply Wall St is general in nature. We provide commentary based on historical data and analyst forecasts only using an unbiased methodology and our articles are not intended to be financial advice. It does not constitute a recommendation to buy or sell any stock, and does not take account of your objectives, or your financial situation. We aim to bring you long-term focused analysis driven by fundamental data. Note that our analysis may not factor in the latest price-sensitive company announcements or qualitative material. Simply Wall St has no position in any stocks mentioned.
About SZSE:002537
HyUnion HoldingLtd
Manufactures and sells automotive lightweight components for automobile brands, independent brands, and other original equipment manufacturers (OEM) in China.
Proven track record with adequate balance sheet.
Market Insights

Advertisement
Community Narratives
MINISO's fair value is projected at 26.69 with an anticipated PE ratio shift of 20x
Fair Value US$24.03|11.0% undervalued
BE
Community Contributor
Procter & Gamble: A Dividend Giant Facing Slowing Growth
Fair Value US$119.81|23.3% overvalued
AN
Community Contributor
Eli Lilly's Future Growth Driven by Tirzepatide and Favorable Market Conditions
Fair Value US$1.19k|13.8% undervalued
EA
Community Contributor