
Advertisement
- China
- /
- Auto Components
- /
- SZSE:002536
Optimistic Investors Push Feilong Auto Components Co., Ltd. (SZSE:002536) Shares Up 30% But Growth Is Lacking
Feilong Auto Components Co., Ltd. (SZSE:002536) shareholders are no doubt pleased to see that the share price has bounced 30% in the last month, although it is still struggling to make up recently lost ground. Looking back a bit further, it's encouraging to see the stock is up 34% in the last year.
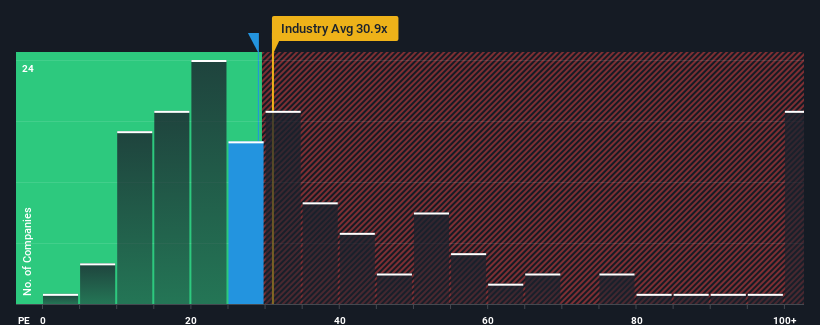
In spite of the firm bounce in price, it's still not a stretch to say that Feilong Auto Components' price-to-earnings (or "P/E") ratio of 29x right now seems quite "middle-of-the-road" compared to the market in China, where the median P/E ratio is around 30x. While this might not raise any eyebrows, if the P/E ratio is not justified investors could be missing out on a potential opportunity or ignoring looming disappointment.
Recent times have been quite advantageous for Feilong Auto Components as its earnings have been rising very briskly. It might be that many expect the strong earnings performance to wane, which has kept the P/E from rising. If you like the company, you'd be hoping this isn't the case so that you could potentially pick up some stock while it's not quite in favour.
View our latest analysis for Feilong Auto Components
How Is Feilong Auto Components' Growth Trending?
In order to justify its P/E ratio, Feilong Auto Components would need to produce growth that's similar to the market.
If we review the last year of earnings growth, the company posted a terrific increase of 194%. The latest three year period has also seen an excellent 82% overall rise in EPS, aided by its short-term performance. So we can start by confirming that the company has done a great job of growing earnings over that time.
Comparing that to the market, which is predicted to deliver 42% growth in the next 12 months, the company's momentum is weaker based on recent medium-term annualised earnings results.
With this information, we find it interesting that Feilong Auto Components is trading at a fairly similar P/E to the market. It seems most investors are ignoring the fairly limited recent growth rates and are willing to pay up for exposure to the stock. Maintaining these prices will be difficult to achieve as a continuation of recent earnings trends is likely to weigh down the shares eventually.
What We Can Learn From Feilong Auto Components' P/E?
Feilong Auto Components' stock has a lot of momentum behind it lately, which has brought its P/E level with the market. While the price-to-earnings ratio shouldn't be the defining factor in whether you buy a stock or not, it's quite a capable barometer of earnings expectations.
We've established that Feilong Auto Components currently trades on a higher than expected P/E since its recent three-year growth is lower than the wider market forecast. When we see weak earnings with slower than market growth, we suspect the share price is at risk of declining, sending the moderate P/E lower. If recent medium-term earnings trends continue, it will place shareholders' investments at risk and potential investors in danger of paying an unnecessary premium.
There are also other vital risk factors to consider before investing and we've discovered 2 warning signs for Feilong Auto Components that you should be aware of.
Of course, you might find a fantastic investment by looking at a few good candidates. So take a peek at this free list of companies with a strong growth track record, trading on a low P/E.
New: AI Stock Screener & Alerts
Our new AI Stock Screener scans the market every day to uncover opportunities.
• Dividend Powerhouses (3%+ Yield)
• Undervalued Small Caps with Insider Buying
• High growth Tech and AI Companies
Or build your own from over 50 metrics.
Have feedback on this article? Concerned about the content? Get in touch with us directly. Alternatively, email editorial-team (at) simplywallst.com.
This article by Simply Wall St is general in nature. We provide commentary based on historical data and analyst forecasts only using an unbiased methodology and our articles are not intended to be financial advice. It does not constitute a recommendation to buy or sell any stock, and does not take account of your objectives, or your financial situation. We aim to bring you long-term focused analysis driven by fundamental data. Note that our analysis may not factor in the latest price-sensitive company announcements or qualitative material. Simply Wall St has no position in any stocks mentioned.
About SZSE:002536
Feilong Auto Components
Feilong Auto Components Co., Ltd., together with its subsidiaries, process, manufactures, and sells auto parts in China and internationally.
Flawless balance sheet with reasonable growth potential.
Market Insights

Advertisement
Community Narratives
MicroVision will explode future revenue by 380.37% with a vision towards success
Fair Value US$60.00|98.4% undervalued
TH
Community Contributor
The Indispensable Artery for a New North American Economy
Fair Value CA$132.87|1.3% undervalued
TI
Community Contributor