
Advertisement
- China
- /
- Auto Components
- /
- SZSE:002536
Calculating The Fair Value Of Feilong Auto Components Co., Ltd. (SZSE:002536)
Key Insights
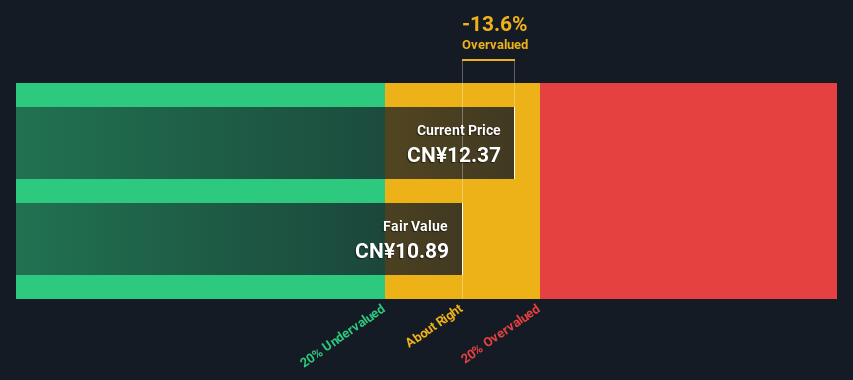
- Using the 2 Stage Free Cash Flow to Equity, Feilong Auto Components fair value estimate is CN¥10.89
- Current share price of CN¥12.37 suggests Feilong Auto Components is potentially trading close to its fair value
- Feilong Auto Components' peers seem to be trading at a higher premium to fair value based onthe industry average of -3,941%
In this article we are going to estimate the intrinsic value of Feilong Auto Components Co., Ltd. (SZSE:002536) by taking the expected future cash flows and discounting them to today's value. This will be done using the Discounted Cash Flow (DCF) model. Believe it or not, it's not too difficult to follow, as you'll see from our example!
Remember though, that there are many ways to estimate a company's value, and a DCF is just one method. Anyone interested in learning a bit more about intrinsic value should have a read of the Simply Wall St analysis model.
View our latest analysis for Feilong Auto Components
Crunching The Numbers
We're using the 2-stage growth model, which simply means we take in account two stages of company's growth. In the initial period the company may have a higher growth rate and the second stage is usually assumed to have a stable growth rate. To begin with, we have to get estimates of the next ten years of cash flows. Seeing as no analyst estimates of free cash flow are available to us, we have extrapolate the previous free cash flow (FCF) from the company's last reported value. We assume companies with shrinking free cash flow will slow their rate of shrinkage, and that companies with growing free cash flow will see their growth rate slow, over this period. We do this to reflect that growth tends to slow more in the early years than it does in later years.
A DCF is all about the idea that a dollar in the future is less valuable than a dollar today, and so the sum of these future cash flows is then discounted to today's value:
10-year free cash flow (FCF) estimate
| 2024 | 2025 | 2026 | 2027 | 2028 | 2029 | 2030 | 2031 | 2032 | 2033 | |
| Levered FCF (CN¥, Millions) | CN¥364.4m | CN¥398.5m | CN¥428.2m | CN¥454.3m | CN¥477.7m | CN¥499.1m | CN¥519.2m | CN¥538.4m | CN¥557.1m | CN¥575.5m |
| Growth Rate Estimate Source | Est @ 12.13% | Est @ 9.38% | Est @ 7.44% | Est @ 6.09% | Est @ 5.15% | Est @ 4.49% | Est @ 4.02% | Est @ 3.70% | Est @ 3.47% | Est @ 3.31% |
| Present Value (CN¥, Millions) Discounted @ 9.8% | CN¥332 | CN¥331 | CN¥323 | CN¥313 | CN¥299 | CN¥285 | CN¥270 | CN¥255 | CN¥240 | CN¥226 |
("Est" = FCF growth rate estimated by Simply Wall St)
Present Value of 10-year Cash Flow (PVCF) = CN¥2.9b
The second stage is also known as Terminal Value, this is the business's cash flow after the first stage. The Gordon Growth formula is used to calculate Terminal Value at a future annual growth rate equal to the 5-year average of the 10-year government bond yield of 2.9%. We discount the terminal cash flows to today's value at a cost of equity of 9.8%.
Terminal Value (TV)= FCF2033 × (1 + g) ÷ (r – g) = CN¥576m× (1 + 2.9%) ÷ (9.8%– 2.9%) = CN¥8.6b
Present Value of Terminal Value (PVTV)= TV / (1 + r)10= CN¥8.6b÷ ( 1 + 9.8%)10= CN¥3.4b
The total value is the sum of cash flows for the next ten years plus the discounted terminal value, which results in the Total Equity Value, which in this case is CN¥6.3b. In the final step we divide the equity value by the number of shares outstanding. Compared to the current share price of CN¥12.4, the company appears around fair value at the time of writing. Valuations are imprecise instruments though, rather like a telescope - move a few degrees and end up in a different galaxy. Do keep this in mind.
The Assumptions
The calculation above is very dependent on two assumptions. The first is the discount rate and the other is the cash flows. You don't have to agree with these inputs, I recommend redoing the calculations yourself and playing with them. The DCF also does not consider the possible cyclicality of an industry, or a company's future capital requirements, so it does not give a full picture of a company's potential performance. Given that we are looking at Feilong Auto Components as potential shareholders, the cost of equity is used as the discount rate, rather than the cost of capital (or weighted average cost of capital, WACC) which accounts for debt. In this calculation we've used 9.8%, which is based on a levered beta of 1.219. Beta is a measure of a stock's volatility, compared to the market as a whole. We get our beta from the industry average beta of globally comparable companies, with an imposed limit between 0.8 and 2.0, which is a reasonable range for a stable business.
Moving On:
Valuation is only one side of the coin in terms of building your investment thesis, and it shouldn't be the only metric you look at when researching a company. DCF models are not the be-all and end-all of investment valuation. Instead the best use for a DCF model is to test certain assumptions and theories to see if they would lead to the company being undervalued or overvalued. For instance, if the terminal value growth rate is adjusted slightly, it can dramatically alter the overall result. For Feilong Auto Components, we've put together three pertinent elements you should further examine:
- Risks: Every company has them, and we've spotted 2 warning signs for Feilong Auto Components you should know about.
- Other High Quality Alternatives: Do you like a good all-rounder? Explore our interactive list of high quality stocks to get an idea of what else is out there you may be missing!
- Other Environmentally-Friendly Companies: Concerned about the environment and think consumers will buy eco-friendly products more and more? Browse through our interactive list of companies that are thinking about a greener future to discover some stocks you may not have thought of!
PS. The Simply Wall St app conducts a discounted cash flow valuation for every stock on the SZSE every day. If you want to find the calculation for other stocks just search here.
New: AI Stock Screener & Alerts
Our new AI Stock Screener scans the market every day to uncover opportunities.
• Dividend Powerhouses (3%+ Yield)
• Undervalued Small Caps with Insider Buying
• High growth Tech and AI Companies
Or build your own from over 50 metrics.
Have feedback on this article? Concerned about the content? Get in touch with us directly. Alternatively, email editorial-team (at) simplywallst.com.
This article by Simply Wall St is general in nature. We provide commentary based on historical data and analyst forecasts only using an unbiased methodology and our articles are not intended to be financial advice. It does not constitute a recommendation to buy or sell any stock, and does not take account of your objectives, or your financial situation. We aim to bring you long-term focused analysis driven by fundamental data. Note that our analysis may not factor in the latest price-sensitive company announcements or qualitative material. Simply Wall St has no position in any stocks mentioned.
About SZSE:002536
Feilong Auto Components
Feilong Auto Components Co., Ltd., together with its subsidiaries, process, manufactures, and sells auto parts in China and internationally.
Flawless balance sheet with reasonable growth potential.
Market Insights

Advertisement
Community Narratives
MicroVision will explode future revenue by 380.37% with a vision towards success
Fair Value US$60.00|98.4% undervalued
TH
Community Contributor
The Indispensable Artery for a New North American Economy
Fair Value CA$132.87|1.3% undervalued
TI
Community Contributor