- China
- /
- Auto Components
- /
- SZSE:002190
After Leaping 26% Sichuan Chengfei Integration Technology Corp.Ltd (SZSE:002190) Shares Are Not Flying Under The Radar

Those holding Sichuan Chengfei Integration Technology Corp.Ltd (SZSE:002190) shares would be relieved that the share price has rebounded 26% in the last thirty days, but it needs to keep going to repair the recent damage it has caused to investor portfolios. Unfortunately, the gains of the last month did little to right the losses of the last year with the stock still down 37% over that time.
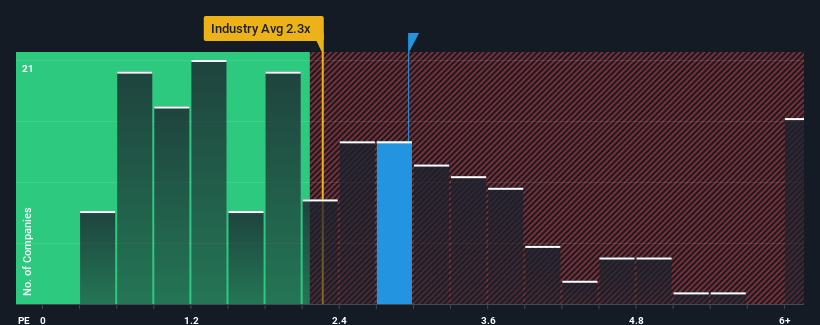
Since its price has surged higher, when almost half of the companies in China's Auto Components industry have price-to-sales ratios (or "P/S") below 2.3x, you may consider Sichuan Chengfei Integration TechnologyLtd as a stock probably not worth researching with its 3x P/S ratio. However, the P/S might be high for a reason and it requires further investigation to determine if it's justified.
See our latest analysis for Sichuan Chengfei Integration TechnologyLtd
What Does Sichuan Chengfei Integration TechnologyLtd's Recent Performance Look Like?
Recent times have been quite advantageous for Sichuan Chengfei Integration TechnologyLtd as its revenue has been rising very briskly. The P/S ratio is probably high because investors think this strong revenue growth will be enough to outperform the broader industry in the near future. You'd really hope so, otherwise you're paying a pretty hefty price for no particular reason.
We don't have analyst forecasts, but you can see how recent trends are setting up the company for the future by checking out our free report on Sichuan Chengfei Integration TechnologyLtd's earnings, revenue and cash flow.Is There Enough Revenue Growth Forecasted For Sichuan Chengfei Integration TechnologyLtd?
The only time you'd be truly comfortable seeing a P/S as high as Sichuan Chengfei Integration TechnologyLtd's is when the company's growth is on track to outshine the industry.
Retrospectively, the last year delivered an exceptional 33% gain to the company's top line. The strong recent performance means it was also able to grow revenue by 128% in total over the last three years. Therefore, it's fair to say the revenue growth recently has been superb for the company.
When compared to the industry's one-year growth forecast of 25%, the most recent medium-term revenue trajectory is noticeably more alluring
In light of this, it's understandable that Sichuan Chengfei Integration TechnologyLtd's P/S sits above the majority of other companies. It seems most investors are expecting this strong growth to continue and are willing to pay more for the stock.
What We Can Learn From Sichuan Chengfei Integration TechnologyLtd's P/S?
Sichuan Chengfei Integration TechnologyLtd shares have taken a big step in a northerly direction, but its P/S is elevated as a result. Using the price-to-sales ratio alone to determine if you should sell your stock isn't sensible, however it can be a practical guide to the company's future prospects.
We've established that Sichuan Chengfei Integration TechnologyLtd maintains its high P/S on the strength of its recent three-year growth being higher than the wider industry forecast, as expected. Right now shareholders are comfortable with the P/S as they are quite confident revenue aren't under threat. Unless the recent medium-term conditions change, they will continue to provide strong support to the share price.
Don't forget that there may be other risks. For instance, we've identified 1 warning sign for Sichuan Chengfei Integration TechnologyLtd that you should be aware of.
If strong companies turning a profit tickle your fancy, then you'll want to check out this free list of interesting companies that trade on a low P/E (but have proven they can grow earnings).
The New Payments ETF Is Live on NASDAQ:
Money is moving to real-time rails, and a newly listed ETF now gives investors direct exposure. Fast settlement. Institutional custody. Simple access.
Explore how this launch could reshape portfolios
Sponsored ContentNew: Manage All Your Stock Portfolios in One Place
We've created the ultimate portfolio companion for stock investors, and it's free.
• Connect an unlimited number of Portfolios and see your total in one currency
• Be alerted to new Warning Signs or Risks via email or mobile
• Track the Fair Value of your stocks
Have feedback on this article? Concerned about the content? Get in touch with us directly. Alternatively, email editorial-team (at) simplywallst.com.
This article by Simply Wall St is general in nature. We provide commentary based on historical data and analyst forecasts only using an unbiased methodology and our articles are not intended to be financial advice. It does not constitute a recommendation to buy or sell any stock, and does not take account of your objectives, or your financial situation. We aim to bring you long-term focused analysis driven by fundamental data. Note that our analysis may not factor in the latest price-sensitive company announcements or qualitative material. Simply Wall St has no position in any stocks mentioned.
About SZSE:002190
Sichuan Chengfei Integration TechnologyLtd
Engages in the design, development, and manufacturing of tooling and molds in China.
Adequate balance sheet and overvalued.
Similar Companies
Market Insights

Weekly Picks

Early mover in a fast growing industry. Likely to experience share price volatility as they scale


A case for CA$31.80 (undiluted), aka 8,616% upside from CA$0.37 (an 86 bagger!).


Moderation and Stabilisation: HOLD: Fair Price based on a 4-year Cycle is $12.08
Recently Updated Narratives

Airbnb Stock: Platform Growth in a World of Saturation and Scrutiny

Adobe Stock: AI-Fueled ARR Growth Pushes Guidance Higher, But Cost Pressures Loom

Thomson Reuters Stock: When Legal Intelligence Becomes Mission-Critical Infrastructure
Popular Narratives


Crazy Undervalued 42 Baggers Silver Play (Active & Running Mine)


NVDA: Expanding AI Demand Will Drive Major Data Center Investments Through 2026

The AI Infrastructure Giant Grows Into Its Valuation
Trending Discussion


