
Advertisement
- China
- /
- Auto Components
- /
- SZSE:000981
What Sensteed Hi-Tech Group's (SZSE:000981) 27% Share Price Gain Is Not Telling You
Sensteed Hi-Tech Group (SZSE:000981) shareholders are no doubt pleased to see that the share price has bounced 27% in the last month, although it is still struggling to make up recently lost ground. Unfortunately, the gains of the last month did little to right the losses of the last year with the stock still down 15% over that time.
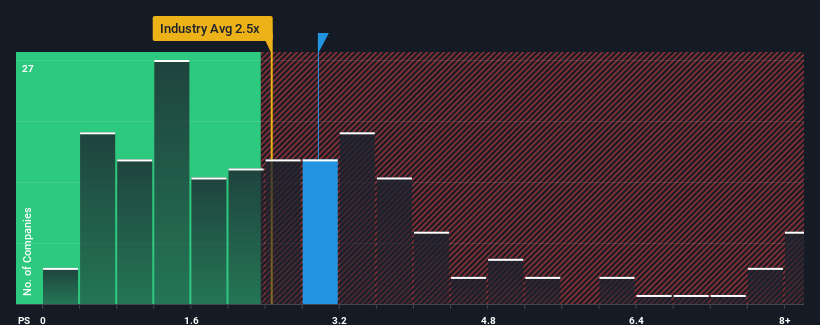
Following the firm bounce in price, you could be forgiven for thinking Sensteed Hi-Tech Group is a stock not worth researching with a price-to-sales ratios (or "P/S") of 3x, considering almost half the companies in China's Auto Components industry have P/S ratios below 2.5x. However, the P/S might be high for a reason and it requires further investigation to determine if it's justified.
View our latest analysis for Sensteed Hi-Tech Group
What Does Sensteed Hi-Tech Group's P/S Mean For Shareholders?
Recent times have been quite advantageous for Sensteed Hi-Tech Group as its revenue has been rising very briskly. It seems that many are expecting the strong revenue performance to beat most other companies over the coming period, which has increased investors’ willingness to pay up for the stock. However, if this isn't the case, investors might get caught out paying too much for the stock.
Want the full picture on earnings, revenue and cash flow for the company? Then our free report on Sensteed Hi-Tech Group will help you shine a light on its historical performance.What Are Revenue Growth Metrics Telling Us About The High P/S?
There's an inherent assumption that a company should outperform the industry for P/S ratios like Sensteed Hi-Tech Group's to be considered reasonable.
If we review the last year of revenue growth, the company posted a terrific increase of 40%. Despite this strong recent growth, it's still struggling to catch up as its three-year revenue frustratingly shrank by 35% overall. So unfortunately, we have to acknowledge that the company has not done a great job of growing revenues over that time.
Weighing that medium-term revenue trajectory against the broader industry's one-year forecast for expansion of 22% shows it's an unpleasant look.
With this in mind, we find it worrying that Sensteed Hi-Tech Group's P/S exceeds that of its industry peers. Apparently many investors in the company are way more bullish than recent times would indicate and aren't willing to let go of their stock at any price. There's a very good chance existing shareholders are setting themselves up for future disappointment if the P/S falls to levels more in line with the recent negative growth rates.
The Final Word
Sensteed Hi-Tech Group shares have taken a big step in a northerly direction, but its P/S is elevated as a result. We'd say the price-to-sales ratio's power isn't primarily as a valuation instrument but rather to gauge current investor sentiment and future expectations.
Our examination of Sensteed Hi-Tech Group revealed its shrinking revenue over the medium-term isn't resulting in a P/S as low as we expected, given the industry is set to grow. Right now we aren't comfortable with the high P/S as this revenue performance is highly unlikely to support such positive sentiment for long. Should recent medium-term revenue trends persist, it would pose a significant risk to existing shareholders' investments and prospective investors will have a hard time accepting the current value of the stock.
There are also other vital risk factors to consider before investing and we've discovered 1 warning sign for Sensteed Hi-Tech Group that you should be aware of.
If strong companies turning a profit tickle your fancy, then you'll want to check out this free list of interesting companies that trade on a low P/E (but have proven they can grow earnings).
New: Manage All Your Stock Portfolios in One Place
We've created the ultimate portfolio companion for stock investors, and it's free.
• Connect an unlimited number of Portfolios and see your total in one currency
• Be alerted to new Warning Signs or Risks via email or mobile
• Track the Fair Value of your stocks
Have feedback on this article? Concerned about the content? Get in touch with us directly. Alternatively, email editorial-team (at) simplywallst.com.
This article by Simply Wall St is general in nature. We provide commentary based on historical data and analyst forecasts only using an unbiased methodology and our articles are not intended to be financial advice. It does not constitute a recommendation to buy or sell any stock, and does not take account of your objectives, or your financial situation. We aim to bring you long-term focused analysis driven by fundamental data. Note that our analysis may not factor in the latest price-sensitive company announcements or qualitative material. Simply Wall St has no position in any stocks mentioned.
About SZSE:000981
Sensteed Hi-Tech Group
Through its subsidiaries, researches and develops, manufactures, and sells automotive transmissions in China and internationally.
Low risk with questionable track record.
Market Insights

Advertisement
Community Narratives
MINISO's fair value is projected at 26.69 with an anticipated PE ratio shift of 20x
Fair Value US$24.03|11.0% undervalued
BE
Community Contributor
Procter & Gamble: A Dividend Giant Facing Slowing Growth
Fair Value US$119.81|23.3% overvalued
AN
Community Contributor
Eli Lilly's Future Growth Driven by Tirzepatide and Favorable Market Conditions
Fair Value US$1.19k|13.8% undervalued
EA
Community Contributor