
Advertisement
- China
- /
- Auto Components
- /
- SHSE:605228
What Shentong Technology Group Co., Ltd's (SHSE:605228) 35% Share Price Gain Is Not Telling You
Those holding Shentong Technology Group Co., Ltd (SHSE:605228) shares would be relieved that the share price has rebounded 35% in the last thirty days, but it needs to keep going to repair the recent damage it has caused to investor portfolios. But the gains over the last month weren't enough to make shareholders whole, as the share price is still down 4.7% in the last twelve months.
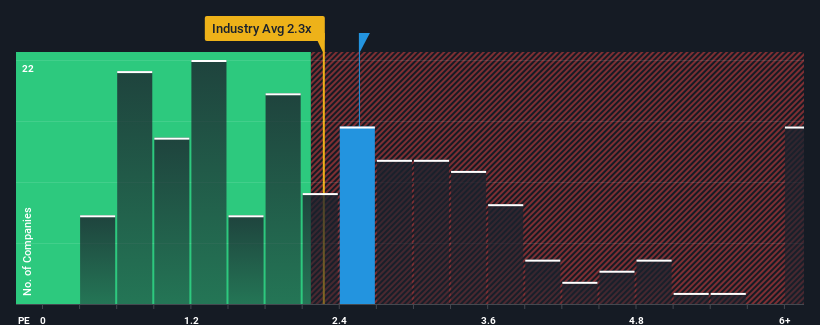
In spite of the firm bounce in price, there still wouldn't be many who think Shentong Technology Group's price-to-sales (or "P/S") ratio of 2.6x is worth a mention when the median P/S in China's Auto Components industry is similar at about 2.3x. Although, it's not wise to simply ignore the P/S without explanation as investors may be disregarding a distinct opportunity or a costly mistake.
View our latest analysis for Shentong Technology Group
What Does Shentong Technology Group's Recent Performance Look Like?
Shentong Technology Group has been doing a decent job lately as it's been growing revenue at a reasonable pace. It might be that many expect the respectable revenue performance to only match most other companies over the coming period, which has kept the P/S from rising. Those who are bullish on Shentong Technology Group will be hoping that this isn't the case, so that they can pick up the stock at a lower valuation.
We don't have analyst forecasts, but you can see how recent trends are setting up the company for the future by checking out our free report on Shentong Technology Group's earnings, revenue and cash flow.Do Revenue Forecasts Match The P/S Ratio?
In order to justify its P/S ratio, Shentong Technology Group would need to produce growth that's similar to the industry.
Retrospectively, the last year delivered a decent 7.0% gain to the company's revenues. Still, revenue has barely risen at all in aggregate from three years ago, which is not ideal. Therefore, it's fair to say that revenue growth has been inconsistent recently for the company.
This is in contrast to the rest of the industry, which is expected to grow by 25% over the next year, materially higher than the company's recent medium-term annualised growth rates.
With this in mind, we find it intriguing that Shentong Technology Group's P/S is comparable to that of its industry peers. It seems most investors are ignoring the fairly limited recent growth rates and are willing to pay up for exposure to the stock. Maintaining these prices will be difficult to achieve as a continuation of recent revenue trends is likely to weigh down the shares eventually.
The Bottom Line On Shentong Technology Group's P/S
Shentong Technology Group appears to be back in favour with a solid price jump bringing its P/S back in line with other companies in the industry Generally, our preference is to limit the use of the price-to-sales ratio to establishing what the market thinks about the overall health of a company.
Our examination of Shentong Technology Group revealed its poor three-year revenue trends aren't resulting in a lower P/S as per our expectations, given they look worse than current industry outlook. Right now we are uncomfortable with the P/S as this revenue performance isn't likely to support a more positive sentiment for long. If recent medium-term revenue trends continue, the probability of a share price decline will become quite substantial, placing shareholders at risk.
There are also other vital risk factors to consider and we've discovered 4 warning signs for Shentong Technology Group (1 is concerning!) that you should be aware of before investing here.
If these risks are making you reconsider your opinion on Shentong Technology Group, explore our interactive list of high quality stocks to get an idea of what else is out there.
New: Manage All Your Stock Portfolios in One Place
We've created the ultimate portfolio companion for stock investors, and it's free.
• Connect an unlimited number of Portfolios and see your total in one currency
• Be alerted to new Warning Signs or Risks via email or mobile
• Track the Fair Value of your stocks
Have feedback on this article? Concerned about the content? Get in touch with us directly. Alternatively, email editorial-team (at) simplywallst.com.
This article by Simply Wall St is general in nature. We provide commentary based on historical data and analyst forecasts only using an unbiased methodology and our articles are not intended to be financial advice. It does not constitute a recommendation to buy or sell any stock, and does not take account of your objectives, or your financial situation. We aim to bring you long-term focused analysis driven by fundamental data. Note that our analysis may not factor in the latest price-sensitive company announcements or qualitative material. Simply Wall St has no position in any stocks mentioned.
About SHSE:605228
Shentong Technology Group
Develops, manufactures, and sells automotive parts in China.
Excellent balance sheet with proven track record.
Market Insights

Advertisement
Community Narratives
MINISO's fair value is projected at 26.69 with an anticipated PE ratio shift of 20x
Fair Value US$24.03|11.0% undervalued
BE
Community Contributor
Procter & Gamble: A Dividend Giant Facing Slowing Growth
Fair Value US$119.81|23.3% overvalued
AN
Community Contributor
Eli Lilly's Future Growth Driven by Tirzepatide and Favorable Market Conditions
Fair Value US$1.19k|13.8% undervalued
EA
Community Contributor