
Advertisement
- China
- /
- Auto Components
- /
- SHSE:603786
KEBODA TECHNOLOGY (SHSE:603786) Might Be Having Difficulty Using Its Capital Effectively
Did you know there are some financial metrics that can provide clues of a potential multi-bagger? In a perfect world, we'd like to see a company investing more capital into its business and ideally the returns earned from that capital are also increasing. Ultimately, this demonstrates that it's a business that is reinvesting profits at increasing rates of return. However, after investigating KEBODA TECHNOLOGY (SHSE:603786), we don't think it's current trends fit the mold of a multi-bagger.
What Is Return On Capital Employed (ROCE)?
If you haven't worked with ROCE before, it measures the 'return' (pre-tax profit) a company generates from capital employed in its business. To calculate this metric for KEBODA TECHNOLOGY, this is the formula:
Return on Capital Employed = Earnings Before Interest and Tax (EBIT) ÷ (Total Assets - Current Liabilities)
0.095 = CN¥432m ÷ (CN¥5.5b - CN¥945m) (Based on the trailing twelve months to June 2023).
So, KEBODA TECHNOLOGY has an ROCE of 9.5%. In absolute terms, that's a low return, but it's much better than the Auto Components industry average of 5.8%.
See our latest analysis for KEBODA TECHNOLOGY
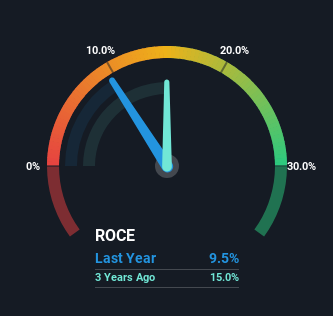
Above you can see how the current ROCE for KEBODA TECHNOLOGY compares to its prior returns on capital, but there's only so much you can tell from the past. If you're interested, you can view the analysts predictions in our free analyst report for KEBODA TECHNOLOGY .
So How Is KEBODA TECHNOLOGY's ROCE Trending?
On the surface, the trend of ROCE at KEBODA TECHNOLOGY doesn't inspire confidence. Over the last five years, returns on capital have decreased to 9.5% from 25% five years ago. However, given capital employed and revenue have both increased it appears that the business is currently pursuing growth, at the consequence of short term returns. And if the increased capital generates additional returns, the business, and thus shareholders, will benefit in the long run.
On a related note, KEBODA TECHNOLOGY has decreased its current liabilities to 17% of total assets. So we could link some of this to the decrease in ROCE. Effectively this means their suppliers or short-term creditors are funding less of the business, which reduces some elements of risk. Some would claim this reduces the business' efficiency at generating ROCE since it is now funding more of the operations with its own money.
In Conclusion...
Even though returns on capital have fallen in the short term, we find it promising that revenue and capital employed have both increased for KEBODA TECHNOLOGY. And there could be an opportunity here if other metrics look good too, because the stock has declined 17% in the last three years. So we think it'd be worthwhile to look further into this stock given the trends look encouraging.
On a separate note, we've found 1 warning sign for KEBODA TECHNOLOGY you'll probably want to know about.
While KEBODA TECHNOLOGY isn't earning the highest return, check out this free list of companies that are earning high returns on equity with solid balance sheets.
Valuation is complex, but we're here to simplify it.
Discover if KEBODA TECHNOLOGY might be undervalued or overvalued with our detailed analysis, featuring fair value estimates, potential risks, dividends, insider trades, and its financial condition.
Access Free AnalysisHave feedback on this article? Concerned about the content? Get in touch with us directly. Alternatively, email editorial-team (at) simplywallst.com.
This article by Simply Wall St is general in nature. We provide commentary based on historical data and analyst forecasts only using an unbiased methodology and our articles are not intended to be financial advice. It does not constitute a recommendation to buy or sell any stock, and does not take account of your objectives, or your financial situation. We aim to bring you long-term focused analysis driven by fundamental data. Note that our analysis may not factor in the latest price-sensitive company announcements or qualitative material. Simply Wall St has no position in any stocks mentioned.
About SHSE:603786
KEBODA TECHNOLOGY
KEBODA TECHNOLOGY Co., Ltd. manufacture and sale of automotive electronics and related products for automotive industry in China.
High growth potential with excellent balance sheet.
Market Insights

Advertisement
Community Narratives
The company that turned a verb into a global necessity and basically runs the modern internet, digital ads, smartphones, maps, and AI.
Fair Value US$300.00|6.3% undervalued
OS
Community Contributor
Flowers Foods Pays A Fair Price For Health
Fair Value US$16.12|26.0% undervalued
NV
Community Contributor
TMX Group will thrive with 33.3% profit margin and enduring market moat
Fair Value CA$49.90|3.7% overvalued
LI
Community Contributor