
Advertisement
- China
- /
- Auto Components
- /
- SHSE:603348
Wencan Group Co., Ltd. (SHSE:603348) Doing What It Can To Lift Shares
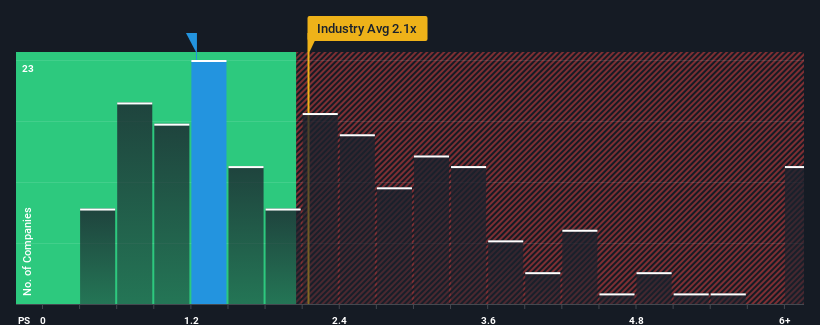
When you see that almost half of the companies in the Auto Components industry in China have price-to-sales ratios (or "P/S") above 2.1x, Wencan Group Co., Ltd. (SHSE:603348) looks to be giving off some buy signals with its 1.2x P/S ratio. Nonetheless, we'd need to dig a little deeper to determine if there is a rational basis for the reduced P/S.
See our latest analysis for Wencan Group
What Does Wencan Group's Recent Performance Look Like?
Recent times haven't been great for Wencan Group as its revenue has been rising slower than most other companies. It seems that many are expecting the uninspiring revenue performance to persist, which has repressed the growth of the P/S ratio. If this is the case, then existing shareholders will probably struggle to get excited about the future direction of the share price.
Want the full picture on analyst estimates for the company? Then our free report on Wencan Group will help you uncover what's on the horizon.How Is Wencan Group's Revenue Growth Trending?
In order to justify its P/S ratio, Wencan Group would need to produce sluggish growth that's trailing the industry.
Taking a look back first, we see that the company managed to grow revenues by a handy 2.5% last year. The latest three year period has also seen an excellent 170% overall rise in revenue, aided somewhat by its short-term performance. So we can start by confirming that the company has done a great job of growing revenues over that time.
Looking ahead now, revenue is anticipated to climb by 27% during the coming year according to the seven analysts following the company. With the industry predicted to deliver 25% growth , the company is positioned for a comparable revenue result.
With this in consideration, we find it intriguing that Wencan Group's P/S is lagging behind its industry peers. Apparently some shareholders are doubtful of the forecasts and have been accepting lower selling prices.
The Key Takeaway
Generally, our preference is to limit the use of the price-to-sales ratio to establishing what the market thinks about the overall health of a company.
Our examination of Wencan Group's revealed that its P/S remains low despite analyst forecasts of revenue growth matching the wider industry. Despite average revenue growth estimates, there could be some unobserved threats keeping the P/S low. At least the risk of a price drop looks to be subdued, but investors seem to think future revenue could see some volatility.
Plus, you should also learn about these 3 warning signs we've spotted with Wencan Group (including 1 which is a bit concerning).
If companies with solid past earnings growth is up your alley, you may wish to see this free collection of other companies with strong earnings growth and low P/E ratios.
Valuation is complex, but we're here to simplify it.
Discover if Wencan Group might be undervalued or overvalued with our detailed analysis, featuring fair value estimates, potential risks, dividends, insider trades, and its financial condition.
Access Free AnalysisHave feedback on this article? Concerned about the content? Get in touch with us directly. Alternatively, email editorial-team (at) simplywallst.com.
This article by Simply Wall St is general in nature. We provide commentary based on historical data and analyst forecasts only using an unbiased methodology and our articles are not intended to be financial advice. It does not constitute a recommendation to buy or sell any stock, and does not take account of your objectives, or your financial situation. We aim to bring you long-term focused analysis driven by fundamental data. Note that our analysis may not factor in the latest price-sensitive company announcements or qualitative material. Simply Wall St has no position in any stocks mentioned.
About SHSE:603348
Wencan Group
Engages in the research and development, production, and sale of aluminum aluminum alloy precision castings in China and internationally.
Undervalued with reasonable growth potential.
Market Insights

Advertisement
Community Narratives
MicroVision will explode future revenue by 380.37% with a vision towards success
Fair Value US$60|98.4% undervalued
TH
Community Contributor
The Indispensable Artery for a New North American Economy
Fair Value CA$132.87|1.6% undervalued
TI
Community Contributor
Recently Updated Narratives
BE


Bejgal on MINISO Group Holding ·
MINISO's fair value is projected at 26.69 with an anticipated PE ratio shift of 20x
Fair Value:US$26.6928.0% undervalued
44 followersusers have followed this narrative
3 commentsusers have commented on this narrative
0 likesusers have liked this narrative
TI


TickerTickle on Oracle ·
The Quiet Giant That Became AI’s Power Grid
Fair Value:US$389.8149.5% undervalued
7 followersusers have followed this narrative
0 commentsusers have commented on this narrative
0 likesusers have liked this narrative
AU

AuCA on Nova Ljubljanska Banka d.d ·
Nova Ljubljanska Banka d.d will expect a 11.2% revenue boost driving future growth
Fair Value:€20916.3% undervalued
23 followersusers have followed this narrative
3 commentsusers have commented on this narrative
0 likesusers have liked this narrative
Popular Narratives
OS


oscargarcia on Alphabet ·
The company that turned a verb into a global necessity and basically runs the modern internet, digital ads, smartphones, maps, and AI.
Fair Value:US$3404.9% undervalued
134 followersusers have followed this narrative
6 commentsusers have commented on this narrative
18 likesusers have liked this narrative
TH

TheWallstreetKing on MicroVision ·
MicroVision will explode future revenue by 380.37% with a vision towards success
Fair Value:US$6098.4% undervalued
83 followersusers have followed this narrative
10 commentsusers have commented on this narrative
18 likesusers have liked this narrative
AN


AnalystConsensusTarget on NVIDIA ·
NVDA: Expanding AI Demand Will Drive Major Data Center Investments Through 2026
Fair Value:US$232.7923.6% undervalued
920 followersusers have followed this narrative
5 commentsusers have commented on this narrative
21 likesusers have liked this narrative