
Advertisement
Key Insights
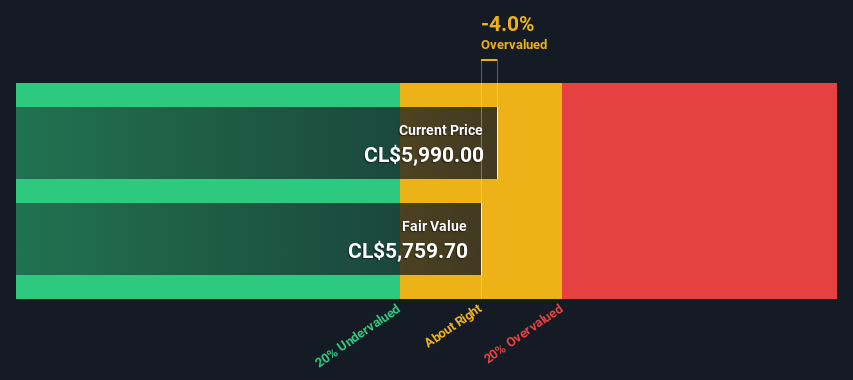
- Empresas Copec's estimated fair value is CL$5,760 based on 2 Stage Free Cash Flow to Equity
- Current share price of CL$5,990 suggests Empresas Copec is potentially trading close to its fair value
- Our fair value estimate is 25% lower than Empresas Copec's analyst price target of US$7,656
In this article we are going to estimate the intrinsic value of Empresas Copec S.A. (SNSE:COPEC) by projecting its future cash flows and then discounting them to today's value. We will take advantage of the Discounted Cash Flow (DCF) model for this purpose. Believe it or not, it's not too difficult to follow, as you'll see from our example!
We generally believe that a company's value is the present value of all of the cash it will generate in the future. However, a DCF is just one valuation metric among many, and it is not without flaws. If you still have some burning questions about this type of valuation, take a look at the Simply Wall St analysis model.
View our latest analysis for Empresas Copec
The Method
We're using the 2-stage growth model, which simply means we take in account two stages of company's growth. In the initial period the company may have a higher growth rate and the second stage is usually assumed to have a stable growth rate. To begin with, we have to get estimates of the next ten years of cash flows. Where possible we use analyst estimates, but when these aren't available we extrapolate the previous free cash flow (FCF) from the last estimate or reported value. We assume companies with shrinking free cash flow will slow their rate of shrinkage, and that companies with growing free cash flow will see their growth rate slow, over this period. We do this to reflect that growth tends to slow more in the early years than it does in later years.
A DCF is all about the idea that a dollar in the future is less valuable than a dollar today, so we need to discount the sum of these future cash flows to arrive at a present value estimate:
10-year free cash flow (FCF) forecast
| 2024 | 2025 | 2026 | 2027 | 2028 | 2029 | 2030 | 2031 | 2032 | 2033 | |
| Levered FCF ($, Millions) | US$1.16b | US$1.10b | US$1.02b | US$984.6m | US$975.5m | US$982.7m | US$1.00b | US$1.03b | US$1.06b | US$1.10b |
| Growth Rate Estimate Source | Analyst x2 | Analyst x2 | Analyst x1 | Est @ -3.28% | Est @ -0.92% | Est @ 0.73% | Est @ 1.89% | Est @ 2.70% | Est @ 3.27% | Est @ 3.66% |
| Present Value ($, Millions) Discounted @ 15% | US$1.0k | US$828 | US$665 | US$559 | US$480 | US$420 | US$371 | US$331 | US$297 | US$267 |
("Est" = FCF growth rate estimated by Simply Wall St)
Present Value of 10-year Cash Flow (PVCF) = US$5.2b
The second stage is also known as Terminal Value, this is the business's cash flow after the first stage. The Gordon Growth formula is used to calculate Terminal Value at a future annual growth rate equal to the 5-year average of the 10-year government bond yield of 4.6%. We discount the terminal cash flows to today's value at a cost of equity of 15%.
Terminal Value (TV)= FCF2033 × (1 + g) ÷ (r – g) = US$1.1b× (1 + 4.6%) ÷ (15%– 4.6%) = US$11b
Present Value of Terminal Value (PVTV)= TV / (1 + r)10= US$11b÷ ( 1 + 15%)10= US$2.6b
The total value is the sum of cash flows for the next ten years plus the discounted terminal value, which results in the Total Equity Value, which in this case is US$7.9b. The last step is to then divide the equity value by the number of shares outstanding. Compared to the current share price of CL$6.0k, the company appears around fair value at the time of writing. Remember though, that this is just an approximate valuation, and like any complex formula - garbage in, garbage out.
The Assumptions
The calculation above is very dependent on two assumptions. The first is the discount rate and the other is the cash flows. If you don't agree with these result, have a go at the calculation yourself and play with the assumptions. The DCF also does not consider the possible cyclicality of an industry, or a company's future capital requirements, so it does not give a full picture of a company's potential performance. Given that we are looking at Empresas Copec as potential shareholders, the cost of equity is used as the discount rate, rather than the cost of capital (or weighted average cost of capital, WACC) which accounts for debt. In this calculation we've used 15%, which is based on a levered beta of 1.821. Beta is a measure of a stock's volatility, compared to the market as a whole. We get our beta from the industry average beta of globally comparable companies, with an imposed limit between 0.8 and 2.0, which is a reasonable range for a stable business.
SWOT Analysis for Empresas Copec
Strength
- Debt is well covered by earnings.
Weakness
- Earnings declined over the past year.
- Dividend is low compared to the top 25% of dividend payers in the Oil and Gas market.
- Current share price is above our estimate of fair value.
Opportunity
- Annual earnings are forecast to grow faster than the Chilean market.
Threat
- Debt is not well covered by operating cash flow.
- Dividends are not covered by earnings.
- Annual revenue is forecast to grow slower than the Chilean market.
Looking Ahead:
Although the valuation of a company is important, it ideally won't be the sole piece of analysis you scrutinize for a company. DCF models are not the be-all and end-all of investment valuation. Instead the best use for a DCF model is to test certain assumptions and theories to see if they would lead to the company being undervalued or overvalued. For instance, if the terminal value growth rate is adjusted slightly, it can dramatically alter the overall result. For Empresas Copec, we've compiled three fundamental items you should explore:
- Risks: Be aware that Empresas Copec is showing 4 warning signs in our investment analysis , and 2 of those are potentially serious...
- Future Earnings: How does COPEC's growth rate compare to its peers and the wider market? Dig deeper into the analyst consensus number for the upcoming years by interacting with our free analyst growth expectation chart.
- Other High Quality Alternatives: Do you like a good all-rounder? Explore our interactive list of high quality stocks to get an idea of what else is out there you may be missing!
PS. The Simply Wall St app conducts a discounted cash flow valuation for every stock on the SNSE every day. If you want to find the calculation for other stocks just search here.
Valuation is complex, but we're here to simplify it.
Discover if Empresas Copec might be undervalued or overvalued with our detailed analysis, featuring fair value estimates, potential risks, dividends, insider trades, and its financial condition.
Access Free AnalysisHave feedback on this article? Concerned about the content? Get in touch with us directly. Alternatively, email editorial-team (at) simplywallst.com.
This article by Simply Wall St is general in nature. We provide commentary based on historical data and analyst forecasts only using an unbiased methodology and our articles are not intended to be financial advice. It does not constitute a recommendation to buy or sell any stock, and does not take account of your objectives, or your financial situation. We aim to bring you long-term focused analysis driven by fundamental data. Note that our analysis may not factor in the latest price-sensitive company announcements or qualitative material. Simply Wall St has no position in any stocks mentioned.
About SNSE:COPEC
Empresas Copec
Operates in the natural resources and energy sectors in Chile and internationally.
Good value with moderate growth potential.
Similar Companies
Market Insights

Advertisement
Community Narratives
MicroVision will explode future revenue by 380.37% with a vision towards success
Fair Value US$60.00|98.5% undervalued
TH
Community Contributor
The Indispensable Artery for a New North American Economy
Fair Value CA$132.87|2.3% undervalued
TI
Community Contributor