- Chile
- /
- Food and Staples Retail
- /
- SNSE:SMU
Pulling back 4.9% this week, SMU's SNSE:SMU) three-year decline in earnings may be coming into investors focus

By buying an index fund, you can roughly match the market return with ease. But if you pick the right individual stocks, you could make more than that. For example, SMU S.A. (SNSE:SMU) shareholders have seen the share price rise 91% over three years, well in excess of the market decline (50%, not including dividends). However, more recent returns haven't been as impressive as that, with the stock returning just 4.6% in the last year, including dividends.
Since the long term performance has been good but there's been a recent pullback of 4.9%, let's check if the fundamentals match the share price.
There is no denying that markets are sometimes efficient, but prices do not always reflect underlying business performance. One flawed but reasonable way to assess how sentiment around a company has changed is to compare the earnings per share (EPS) with the share price.
During the three years of share price growth, SMU actually saw its earnings per share (EPS) drop 33% per year.
So we doubt that the market is looking to EPS for its main judge of the company's value. Given this situation, it makes sense to look at other metrics too.
We severely doubt anyone is particularly impressed with the modest 2.7% three-year revenue growth rate. So truth be told we can't see an easy explanation for the share price action, but perhaps you can...
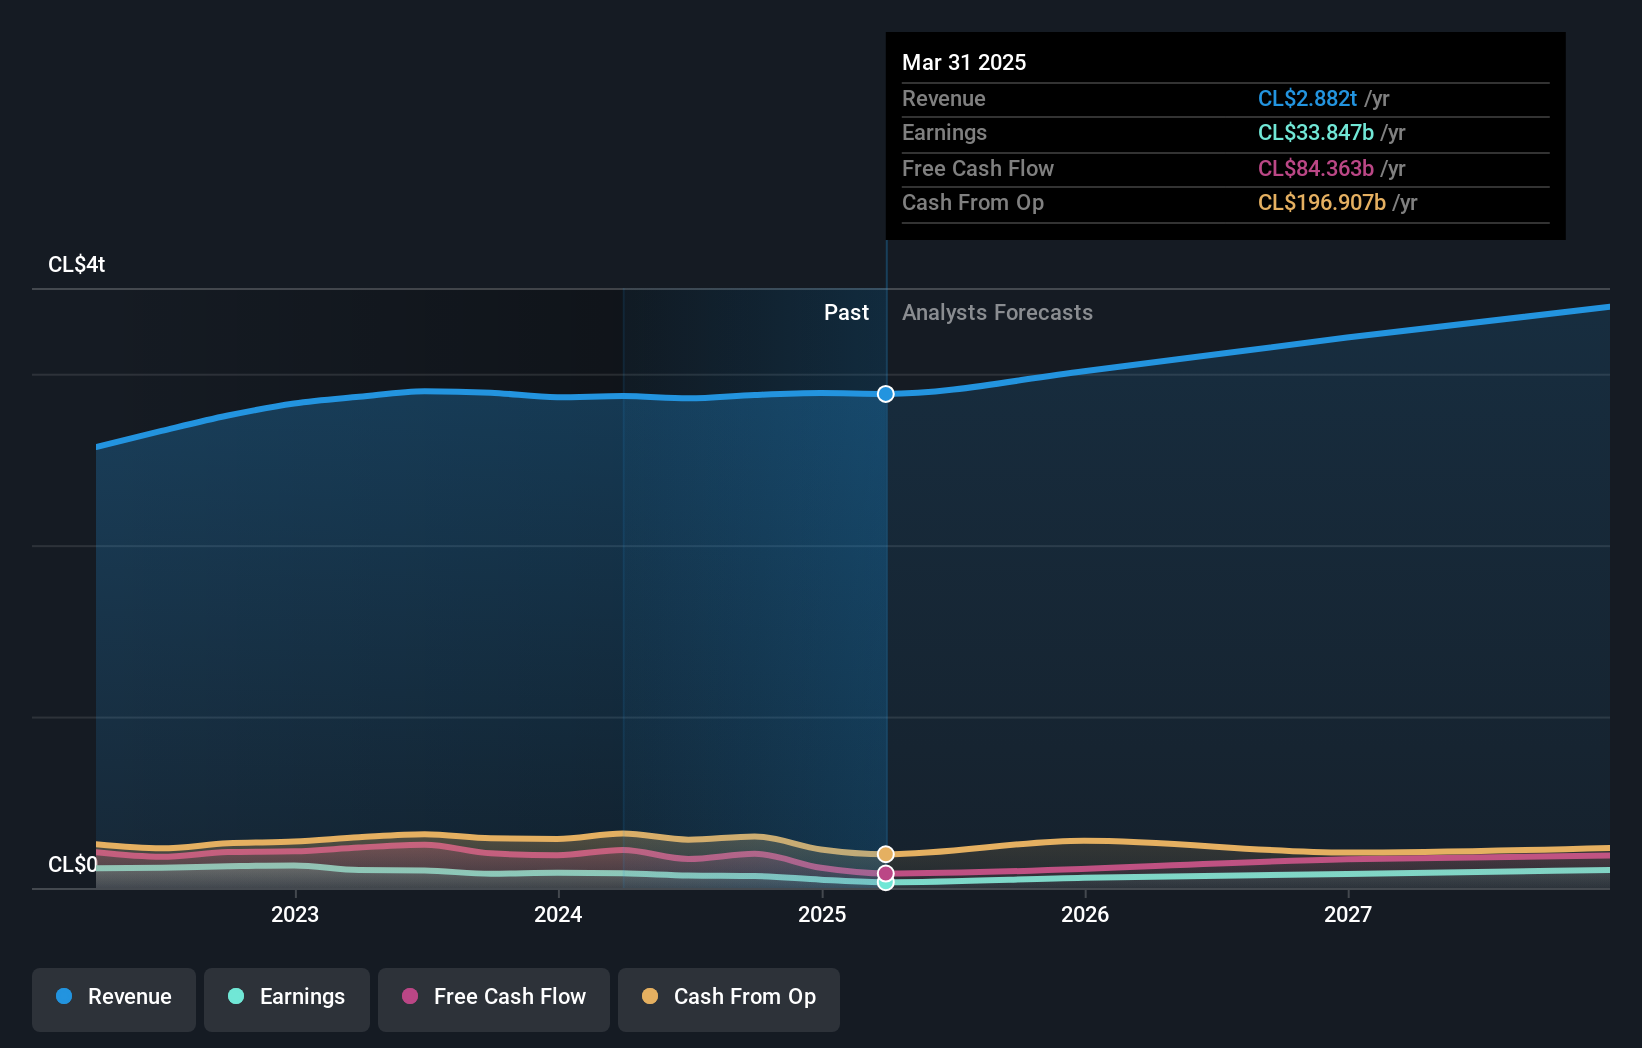
The image below shows how earnings and revenue have tracked over time (if you click on the image you can see greater detail).
Balance sheet strength is crucial. It might be well worthwhile taking a look at our free report on how its financial position has changed over time.

What About Dividends?
It is important to consider the total shareholder return, as well as the share price return, for any given stock. The TSR incorporates the value of any spin-offs or discounted capital raisings, along with any dividends, based on the assumption that the dividends are reinvested. It's fair to say that the TSR gives a more complete picture for stocks that pay a dividend. We note that for SMU the TSR over the last 3 years was 134%, which is better than the share price return mentioned above. This is largely a result of its dividend payments!
A Different Perspective
SMU provided a TSR of 4.6% over the last twelve months. But that was short of the market average. If we look back over five years, the returns are even better, coming in at 11% per year for five years. Maybe the share price is just taking a breather while the business executes on its growth strategy. It's always interesting to track share price performance over the longer term. But to understand SMU better, we need to consider many other factors. Consider for instance, the ever-present spectre of investment risk. We've identified 4 warning signs with SMU (at least 1 which shouldn't be ignored) , and understanding them should be part of your investment process.
But note: SMU may not be the best stock to buy. So take a peek at this free list of interesting companies with past earnings growth (and further growth forecast).
Please note, the market returns quoted in this article reflect the market weighted average returns of stocks that currently trade on Chilean exchanges.
The New Payments ETF Is Live on NASDAQ:
Money is moving to real-time rails, and a newly listed ETF now gives investors direct exposure. Fast settlement. Institutional custody. Simple access.
Explore how this launch could reshape portfolios
Sponsored ContentNew: Manage All Your Stock Portfolios in One Place
We've created the ultimate portfolio companion for stock investors, and it's free.
• Connect an unlimited number of Portfolios and see your total in one currency
• Be alerted to new Warning Signs or Risks via email or mobile
• Track the Fair Value of your stocks
Have feedback on this article? Concerned about the content? Get in touch with us directly. Alternatively, email editorial-team (at) simplywallst.com.
This article by Simply Wall St is general in nature. We provide commentary based on historical data and analyst forecasts only using an unbiased methodology and our articles are not intended to be financial advice. It does not constitute a recommendation to buy or sell any stock, and does not take account of your objectives, or your financial situation. We aim to bring you long-term focused analysis driven by fundamental data. Note that our analysis may not factor in the latest price-sensitive company announcements or qualitative material. Simply Wall St has no position in any stocks mentioned.
About SNSE:SMU
Fair value second-rate dividend payer.
Similar Companies
Market Insights

Weekly Picks

Early mover in a fast growing industry. Likely to experience share price volatility as they scale


A case for CA$31.80 (undiluted), aka 8,616% upside from CA$0.37 (an 86 bagger!).


Moderation and Stabilisation: HOLD: Fair Price based on a 4-year Cycle is $12.08
Recently Updated Narratives

Automotive Electronics Manufacturer Consistent and Stable

Airbnb Stock: Platform Growth in a World of Saturation and Scrutiny

Adobe Stock: AI-Fueled ARR Growth Pushes Guidance Higher, But Cost Pressures Loom
Popular Narratives


Crazy Undervalued 42 Baggers Silver Play (Active & Running Mine)


NVDA: Expanding AI Demand Will Drive Major Data Center Investments Through 2026

The AI Infrastructure Giant Grows Into Its Valuation
Trending Discussion


