- Switzerland
- /
- Tech Hardware
- /
- SWX:LOGN
Calculating The Fair Value Of Logitech International S.A. (VTX:LOGN)


Key Insights
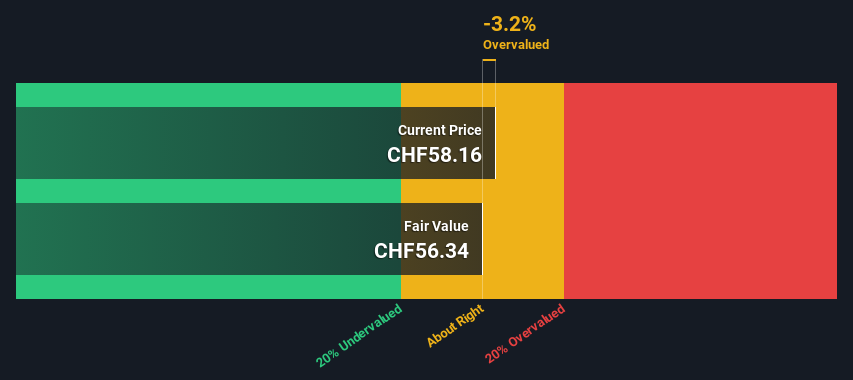
- Logitech International's estimated fair value is CHF56.34 based on 2 Stage Free Cash Flow to Equity
- Current share price of CHF58.16 suggests Logitech International is potentially trading close to its fair value
- Our fair value estimate is 4.7% lower than Logitech International's analyst price target of US$59.15
Today we'll do a simple run through of a valuation method used to estimate the attractiveness of Logitech International S.A. (VTX:LOGN) as an investment opportunity by taking the forecast future cash flows of the company and discounting them back to today's value. Our analysis will employ the Discounted Cash Flow (DCF) model. Models like these may appear beyond the comprehension of a lay person, but they're fairly easy to follow.
Remember though, that there are many ways to estimate a company's value, and a DCF is just one method. For those who are keen learners of equity analysis, the Simply Wall St analysis model here may be something of interest to you.
View our latest analysis for Logitech International
The Method
We are going to use a two-stage DCF model, which, as the name states, takes into account two stages of growth. The first stage is generally a higher growth period which levels off heading towards the terminal value, captured in the second 'steady growth' period. To start off with, we need to estimate the next ten years of cash flows. Where possible we use analyst estimates, but when these aren't available we extrapolate the previous free cash flow (FCF) from the last estimate or reported value. We assume companies with shrinking free cash flow will slow their rate of shrinkage, and that companies with growing free cash flow will see their growth rate slow, over this period. We do this to reflect that growth tends to slow more in the early years than it does in later years.
A DCF is all about the idea that a dollar in the future is less valuable than a dollar today, so we need to discount the sum of these future cash flows to arrive at a present value estimate:
10-year free cash flow (FCF) forecast
| 2024 | 2025 | 2026 | 2027 | 2028 | 2029 | 2030 | 2031 | 2032 | 2033 | |
| Levered FCF ($, Millions) | US$517.2m | US$547.7m | US$589.2m | US$540.0m | US$590.0m | US$595.7m | US$599.7m | US$602.6m | US$604.6m | US$606.0m |
| Growth Rate Estimate Source | Analyst x6 | Analyst x7 | Analyst x5 | Analyst x1 | Analyst x1 | Est @ 0.96% | Est @ 0.68% | Est @ 0.48% | Est @ 0.34% | Est @ 0.24% |
| Present Value ($, Millions) Discounted @ 5.9% | US$489 | US$489 | US$497 | US$430 | US$444 | US$423 | US$403 | US$382 | US$362 | US$343 |
("Est" = FCF growth rate estimated by Simply Wall St)
Present Value of 10-year Cash Flow (PVCF) = US$4.3b
The second stage is also known as Terminal Value, this is the business's cash flow after the first stage. The Gordon Growth formula is used to calculate Terminal Value at a future annual growth rate equal to the 5-year average of the 10-year government bond yield of 0.01%. We discount the terminal cash flows to today's value at a cost of equity of 5.9%.
Terminal Value (TV)= FCF2033 × (1 + g) ÷ (r – g) = US$606m× (1 + 0.01%) ÷ (5.9%– 0.01%) = US$10b
Present Value of Terminal Value (PVTV)= TV / (1 + r)10= US$10b÷ ( 1 + 5.9%)10= US$5.9b
The total value, or equity value, is then the sum of the present value of the future cash flows, which in this case is US$10b. To get the intrinsic value per share, we divide this by the total number of shares outstanding. Compared to the current share price of CHF58.2, the company appears around fair value at the time of writing. The assumptions in any calculation have a big impact on the valuation, so it is better to view this as a rough estimate, not precise down to the last cent.
Important Assumptions
Now the most important inputs to a discounted cash flow are the discount rate, and of course, the actual cash flows. Part of investing is coming up with your own evaluation of a company's future performance, so try the calculation yourself and check your own assumptions. The DCF also does not consider the possible cyclicality of an industry, or a company's future capital requirements, so it does not give a full picture of a company's potential performance. Given that we are looking at Logitech International as potential shareholders, the cost of equity is used as the discount rate, rather than the cost of capital (or weighted average cost of capital, WACC) which accounts for debt. In this calculation we've used 5.9%, which is based on a levered beta of 1.169. Beta is a measure of a stock's volatility, compared to the market as a whole. We get our beta from the industry average beta of globally comparable companies, with an imposed limit between 0.8 and 2.0, which is a reasonable range for a stable business.
SWOT Analysis for Logitech International
- Currently debt free.
- Dividends are covered by earnings and cash flows.
- Earnings declined over the past year.
- Dividend is low compared to the top 25% of dividend payers in the Tech market.
- Annual earnings are forecast to grow faster than the Swiss market.
- Good value based on P/E ratio compared to estimated Fair P/E ratio.
- Annual revenue is forecast to grow slower than the Swiss market.
Moving On:
Whilst important, the DCF calculation is only one of many factors that you need to assess for a company. It's not possible to obtain a foolproof valuation with a DCF model. Preferably you'd apply different cases and assumptions and see how they would impact the company's valuation. If a company grows at a different rate, or if its cost of equity or risk free rate changes sharply, the output can look very different. For Logitech International, we've put together three further aspects you should assess:
- Risks: Case in point, we've spotted 1 warning sign for Logitech International you should be aware of.
- Future Earnings: How does LOGN's growth rate compare to its peers and the wider market? Dig deeper into the analyst consensus number for the upcoming years by interacting with our free analyst growth expectation chart.
- Other High Quality Alternatives: Do you like a good all-rounder? Explore our interactive list of high quality stocks to get an idea of what else is out there you may be missing!
PS. The Simply Wall St app conducts a discounted cash flow valuation for every stock on the SWX every day. If you want to find the calculation for other stocks just search here.
New: AI Stock Screener & Alerts
Our new AI Stock Screener scans the market every day to uncover opportunities.
• Dividend Powerhouses (3%+ Yield)
• Undervalued Small Caps with Insider Buying
• High growth Tech and AI Companies
Or build your own from over 50 metrics.
Have feedback on this article? Concerned about the content? Get in touch with us directly. Alternatively, email editorial-team (at) simplywallst.com.
This article by Simply Wall St is general in nature. We provide commentary based on historical data and analyst forecasts only using an unbiased methodology and our articles are not intended to be financial advice. It does not constitute a recommendation to buy or sell any stock, and does not take account of your objectives, or your financial situation. We aim to bring you long-term focused analysis driven by fundamental data. Note that our analysis may not factor in the latest price-sensitive company announcements or qualitative material. Simply Wall St has no position in any stocks mentioned.
About SWX:LOGN
Logitech International
Through its subsidiaries, designs, manufactures, and markets software-enabled hardware solutions that connect people to working, creating, gaming, and streaming worldwide.
Flawless balance sheet with solid track record and pays a dividend.

