
Advertisement
- Switzerland
- /
- Semiconductors
- /
- SWX:AMS
The Market Doesn't Like What It Sees From ams-OSRAM AG's (VTX:AMS) Revenues Yet As Shares Tumble 38%
ams-OSRAM AG (VTX:AMS) shares have had a horrible month, losing 38% after a relatively good period beforehand. The recent drop completes a disastrous twelve months for shareholders, who are sitting on a 81% loss during that time.
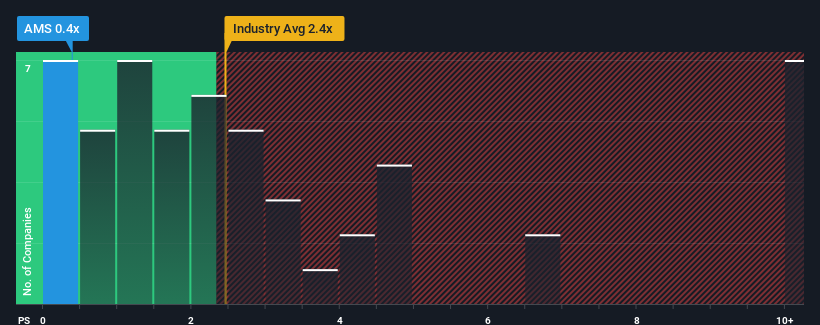
Following the heavy fall in price, ams-OSRAM may be sending very bullish signals at the moment with its price-to-sales (or "P/S") ratio of 0.4x, since almost half of all companies in the Semiconductor industry in Switzerland have P/S ratios greater than 2.4x and even P/S higher than 5x are not unusual. However, the P/S might be quite low for a reason and it requires further investigation to determine if it's justified.
Check out our latest analysis for ams-OSRAM
How ams-OSRAM Has Been Performing
ams-OSRAM hasn't been tracking well recently as its declining revenue compares poorly to other companies, which have seen some growth in their revenues on average. Perhaps the P/S remains low as investors think the prospects of strong revenue growth aren't on the horizon. If this is the case, then existing shareholders will probably struggle to get excited about the future direction of the share price.
If you'd like to see what analysts are forecasting going forward, you should check out our free report on ams-OSRAM.Do Revenue Forecasts Match The Low P/S Ratio?
The only time you'd be truly comfortable seeing a P/S as depressed as ams-OSRAM's is when the company's growth is on track to lag the industry decidedly.
Taking a look back first, the company's revenue growth last year wasn't something to get excited about as it posted a disappointing decline of 26%. Unfortunately, that's brought it right back to where it started three years ago with revenue growth being virtually non-existent overall during that time. So it appears to us that the company has had a mixed result in terms of growing revenue over that time.
Looking ahead now, revenue is anticipated to climb by 4.6% each year during the coming three years according to the ten analysts following the company. Meanwhile, the rest of the industry is forecast to expand by 12% per year, which is noticeably more attractive.
With this in consideration, its clear as to why ams-OSRAM's P/S is falling short industry peers. Apparently many shareholders weren't comfortable holding on while the company is potentially eyeing a less prosperous future.
What Does ams-OSRAM's P/S Mean For Investors?
Having almost fallen off a cliff, ams-OSRAM's share price has pulled its P/S way down as well. While the price-to-sales ratio shouldn't be the defining factor in whether you buy a stock or not, it's quite a capable barometer of revenue expectations.
As expected, our analysis of ams-OSRAM's analyst forecasts confirms that the company's underwhelming revenue outlook is a major contributor to its low P/S. Shareholders' pessimism on the revenue prospects for the company seems to be the main contributor to the depressed P/S. Unless these conditions improve, they will continue to form a barrier for the share price around these levels.
Having said that, be aware ams-OSRAM is showing 2 warning signs in our investment analysis, you should know about.
If companies with solid past earnings growth is up your alley, you may wish to see this free collection of other companies with strong earnings growth and low P/E ratios.
New: AI Stock Screener & Alerts
Our new AI Stock Screener scans the market every day to uncover opportunities.
• Dividend Powerhouses (3%+ Yield)
• Undervalued Small Caps with Insider Buying
• High growth Tech and AI Companies
Or build your own from over 50 metrics.
Have feedback on this article? Concerned about the content? Get in touch with us directly. Alternatively, email editorial-team (at) simplywallst.com.
This article by Simply Wall St is general in nature. We provide commentary based on historical data and analyst forecasts only using an unbiased methodology and our articles are not intended to be financial advice. It does not constitute a recommendation to buy or sell any stock, and does not take account of your objectives, or your financial situation. We aim to bring you long-term focused analysis driven by fundamental data. Note that our analysis may not factor in the latest price-sensitive company announcements or qualitative material. Simply Wall St has no position in any stocks mentioned.
About SWX:AMS
ams-OSRAM
Engages in the design, manufacture, and sale of LED and optical sensor solutions in Europe, the Middle East, Africa, the Americas, and the Asia/Pacific.
Undervalued with reasonable growth potential.
Market Insights

Advertisement
Community Narratives
MicroVision will explode future revenue by 380.37% with a vision towards success
Fair Value US$60.00|98.4% undervalued
TH
Community Contributor
The Indispensable Artery for a New North American Economy
Fair Value CA$132.87|1.3% undervalued
TI
Community Contributor