Stock Analysis
- Switzerland
- /
- Semiconductors
- /
- SWX:AMS
ams-OSRAM AG's (VTX:AMS) market cap touched CHF1.4b last week, benefiting both individual investors who own 53% as well as institutions


Key Insights
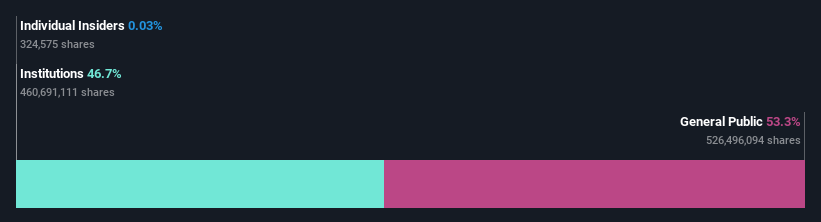
- ams-OSRAM's significant individual investors ownership suggests that the key decisions are influenced by shareholders from the larger public
- The top 25 shareholders own 43% of the company
- Institutions own 47% of ams-OSRAM
If you want to know who really controls ams-OSRAM AG (VTX:AMS), then you'll have to look at the makeup of its share registry. With 53% stake, individual investors possess the maximum shares in the company. That is, the group stands to benefit the most if the stock rises (or lose the most if there is a downturn).
While individual investors were the group that benefitted the most from last week’s CHF53m market cap gain, institutions too had a 47% share in those profits.
Let's delve deeper into each type of owner of ams-OSRAM, beginning with the chart below.
See our latest analysis for ams-OSRAM
What Does The Institutional Ownership Tell Us About ams-OSRAM?
Many institutions measure their performance against an index that approximates the local market. So they usually pay more attention to companies that are included in major indices.
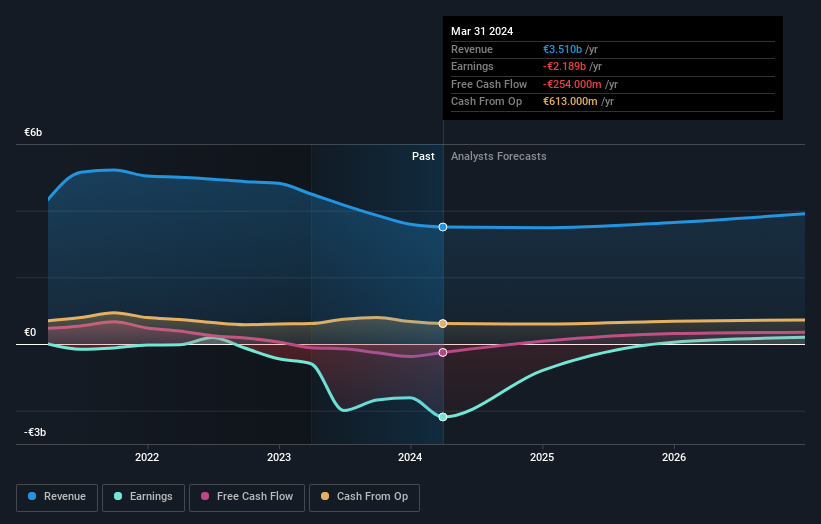
As you can see, institutional investors have a fair amount of stake in ams-OSRAM. This suggests some credibility amongst professional investors. But we can't rely on that fact alone since institutions make bad investments sometimes, just like everyone does. If multiple institutions change their view on a stock at the same time, you could see the share price drop fast. It's therefore worth looking at ams-OSRAM's earnings history below. Of course, the future is what really matters.
Hedge funds don't have many shares in ams-OSRAM. Our data shows that UBS Asset Management AG is the largest shareholder with 6.8% of shares outstanding. In comparison, the second and third largest shareholders hold about 6.1% and 3.4% of the stock.
A deeper look at our ownership data shows that the top 25 shareholders collectively hold less than half of the register, suggesting a large group of small holders where no single shareholder has a majority.
While it makes sense to study institutional ownership data for a company, it also makes sense to study analyst sentiments to know which way the wind is blowing. There are a reasonable number of analysts covering the stock, so it might be useful to find out their aggregate view on the future.
Insider Ownership Of ams-OSRAM
The definition of an insider can differ slightly between different countries, but members of the board of directors always count. Management ultimately answers to the board. However, it is not uncommon for managers to be executive board members, especially if they are a founder or the CEO.
I generally consider insider ownership to be a good thing. However, on some occasions it makes it more difficult for other shareholders to hold the board accountable for decisions.
Our most recent data indicates that insiders own less than 1% of ams-OSRAM AG. Keep in mind that it's a big company, and the insiders own CHF467k worth of shares. The absolute value might be more important than the proportional share. Arguably, recent buying and selling is just as important to consider. You can click here to see if insiders have been buying or selling.
General Public Ownership
The general public -- including retail investors -- own 53% of ams-OSRAM. This size of ownership gives investors from the general public some collective power. They can and probably do influence decisions on executive compensation, dividend policies and proposed business acquisitions.
Next Steps:
I find it very interesting to look at who exactly owns a company. But to truly gain insight, we need to consider other information, too. To that end, you should be aware of the 2 warning signs we've spotted with ams-OSRAM .
But ultimately it is the future, not the past, that will determine how well the owners of this business will do. Therefore we think it advisable to take a look at this free report showing whether analysts are predicting a brighter future.
NB: Figures in this article are calculated using data from the last twelve months, which refer to the 12-month period ending on the last date of the month the financial statement is dated. This may not be consistent with full year annual report figures.
Valuation is complex, but we're helping make it simple.
Find out whether ams-OSRAM is potentially over or undervalued by checking out our comprehensive analysis, which includes fair value estimates, risks and warnings, dividends, insider transactions and financial health.
View the Free AnalysisHave feedback on this article? Concerned about the content? Get in touch with us directly. Alternatively, email editorial-team (at) simplywallst.com.
This article by Simply Wall St is general in nature. We provide commentary based on historical data and analyst forecasts only using an unbiased methodology and our articles are not intended to be financial advice. It does not constitute a recommendation to buy or sell any stock, and does not take account of your objectives, or your financial situation. We aim to bring you long-term focused analysis driven by fundamental data. Note that our analysis may not factor in the latest price-sensitive company announcements or qualitative material. Simply Wall St has no position in any stocks mentioned.
About SWX:AMS
ams-OSRAM
Designs, manufactures, and sells LED and optical sensor solutions in Europe, the Middle East, Africa, the Americas, and the Asia/Pacific.
Undervalued with reasonable growth potential.
