
Advertisement
- Switzerland
- /
- Semiconductors
- /
- SWX:AMS
ams-OSRAM AG (VTX:AMS) Held Back By Insufficient Growth Even After Shares Climb 29%
ams-OSRAM AG (VTX:AMS) shareholders would be excited to see that the share price has had a great month, posting a 29% gain and recovering from prior weakness. Still, the 30-day jump doesn't change the fact that longer term shareholders have seen their stock decimated by the 79% share price drop in the last twelve months.
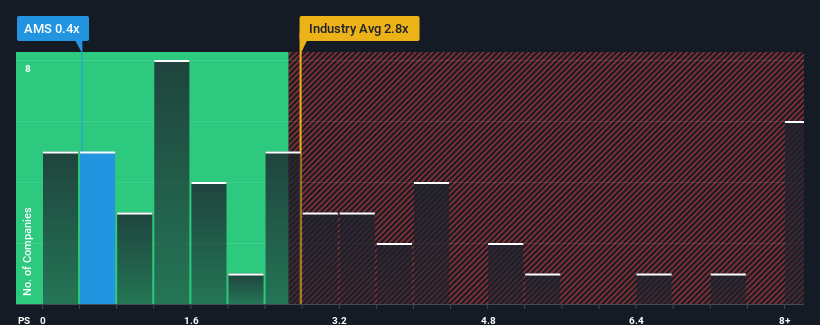
Even after such a large jump in price, ams-OSRAM may still look like a strong buying opportunity at present with its price-to-sales (or "P/S") ratio of 0.4x, considering almost half of all companies in the Semiconductor industry in Switzerland have P/S ratios greater than 2.8x and even P/S higher than 5x aren't out of the ordinary. However, the P/S might be quite low for a reason and it requires further investigation to determine if it's justified.
Check out our latest analysis for ams-OSRAM
How ams-OSRAM Has Been Performing
ams-OSRAM could be doing better as its revenue has been going backwards lately while most other companies have been seeing positive revenue growth. It seems that many are expecting the poor revenue performance to persist, which has repressed the P/S ratio. So while you could say the stock is cheap, investors will be looking for improvement before they see it as good value.
Keen to find out how analysts think ams-OSRAM's future stacks up against the industry? In that case, our free report is a great place to start.Do Revenue Forecasts Match The Low P/S Ratio?
The only time you'd be truly comfortable seeing a P/S as depressed as ams-OSRAM's is when the company's growth is on track to lag the industry decidedly.
Retrospectively, the last year delivered a frustrating 22% decrease to the company's top line. This means it has also seen a slide in revenue over the longer-term as revenue is down 19% in total over the last three years. So unfortunately, we have to acknowledge that the company has not done a great job of growing revenue over that time.
Shifting to the future, estimates from the nine analysts covering the company suggest revenue should grow by 5.2% per annum over the next three years. That's shaping up to be materially lower than the 15% per year growth forecast for the broader industry.
With this information, we can see why ams-OSRAM is trading at a P/S lower than the industry. It seems most investors are expecting to see limited future growth and are only willing to pay a reduced amount for the stock.
What Does ams-OSRAM's P/S Mean For Investors?
Even after such a strong price move, ams-OSRAM's P/S still trails the rest of the industry. Typically, we'd caution against reading too much into price-to-sales ratios when settling on investment decisions, though it can reveal plenty about what other market participants think about the company.
As we suspected, our examination of ams-OSRAM's analyst forecasts revealed that its inferior revenue outlook is contributing to its low P/S. Shareholders' pessimism on the revenue prospects for the company seems to be the main contributor to the depressed P/S. It's hard to see the share price rising strongly in the near future under these circumstances.
You should always think about risks. Case in point, we've spotted 2 warning signs for ams-OSRAM you should be aware of.
If these risks are making you reconsider your opinion on ams-OSRAM, explore our interactive list of high quality stocks to get an idea of what else is out there.
New: AI Stock Screener & Alerts
Our new AI Stock Screener scans the market every day to uncover opportunities.
• Dividend Powerhouses (3%+ Yield)
• Undervalued Small Caps with Insider Buying
• High growth Tech and AI Companies
Or build your own from over 50 metrics.
Have feedback on this article? Concerned about the content? Get in touch with us directly. Alternatively, email editorial-team (at) simplywallst.com.
This article by Simply Wall St is general in nature. We provide commentary based on historical data and analyst forecasts only using an unbiased methodology and our articles are not intended to be financial advice. It does not constitute a recommendation to buy or sell any stock, and does not take account of your objectives, or your financial situation. We aim to bring you long-term focused analysis driven by fundamental data. Note that our analysis may not factor in the latest price-sensitive company announcements or qualitative material. Simply Wall St has no position in any stocks mentioned.
About SWX:AMS
ams-OSRAM
Engages in the design, manufacture, and sale of LED and optical sensor solutions in Europe, the Middle East, Africa, the Americas, and the Asia/Pacific.
Undervalued with reasonable growth potential.
Market Insights

Advertisement
Community Narratives
MicroVision will explode future revenue by 380.37% with a vision towards success
Fair Value US$60.00|98.4% undervalued
TH
Community Contributor
The Indispensable Artery for a New North American Economy
Fair Value CA$132.87|1.3% undervalued
TI
Community Contributor