Advertisement
- Switzerland
- /
- Pharma
- /
- SWX:ROG
Roche Stock Slides 9.5% as New Drug Developments Spark Fresh Valuation Debate

Simply Wall St
Reviewed by Bailey Pemberton
- Ever find yourself wondering if Roche Holding is a hidden gem or just another pharmaceutical heavyweight trading at a premium? You are not alone. Today we are cutting through the noise to tackle exactly how to think about its value.
- Despite a recent 3.0% dip over the last week and a 9.5% slide in the past month, Roche Holding is still up 1.1% since the start of the year. This suggests the market is still weighing its long-term prospects against short-term bumps.
- Recent announcements about new drug developments and regulatory approvals have stirred up both excitement and caution among investors. These updates help explain the stock's recent volatility as the market reacts to potential shifts in drug pipelines and competitive positioning.
- When we run Roche Holding through our simple valuation checks, it scores a 4 out of 6 on our valuation scoreboard. This indicates some areas of undervaluation but not a slam dunk. Let us dig into what this means, compare some common approaches, and hint at an even deeper way to look at value, which we will reveal by the end of this article.
Find out why Roche Holding's -1.5% return over the last year is lagging behind its peers.
Approach 1: Roche Holding Discounted Cash Flow (DCF) Analysis
A Discounted Cash Flow (DCF) model estimates a company's intrinsic value by projecting its future cash flows and discounting them back to their present value. This approach helps investors understand what the business could be worth today based on its ability to generate cash in the years ahead.
For Roche Holding, the most recent Free Cash Flow (FCF) reported is CHF 14.08 billion. Analysts provide explicit forecasts up to 2029, showing steady growth, with projected FCF rising to CHF 19.07 billion by then. After 2029, Simply Wall St extrapolates further growth, although with increasing uncertainty. All cash flow figures are denominated in Swiss Francs (CHF).
Based on the DCF analysis, Roche’s fair value per share is estimated at CHF 707.10. This is significantly above the current share price and implies the stock is trading at a 63.3% discount to its calculated intrinsic value. In plain terms, the market may be underestimating Roche’s long-term cash-generating capacity.
Result: UNDERVALUED
Our Discounted Cash Flow (DCF) analysis suggests Roche Holding is undervalued by 63.3%. Track this in your watchlist or portfolio, or discover 842 more undervalued stocks based on cash flows.

Approach 2: Roche Holding Price vs Earnings (PE Ratio)
The Price-to-Earnings (PE) ratio is a widely used valuation metric for profitable companies like Roche Holding because it directly links a company's share price to its earnings, helping investors gauge how much they are paying for each unit of profit. For established businesses generating consistent earnings, the PE ratio offers a straightforward way to compare value.
What constitutes a “fair” PE ratio can vary. Companies with higher expected growth, lower perceived risk, and strong profit margins typically deserve higher PE ratios since investors are willing to pay more for potential future earnings. In contrast, lower growth or additional risks may lead to a discounted multiple.
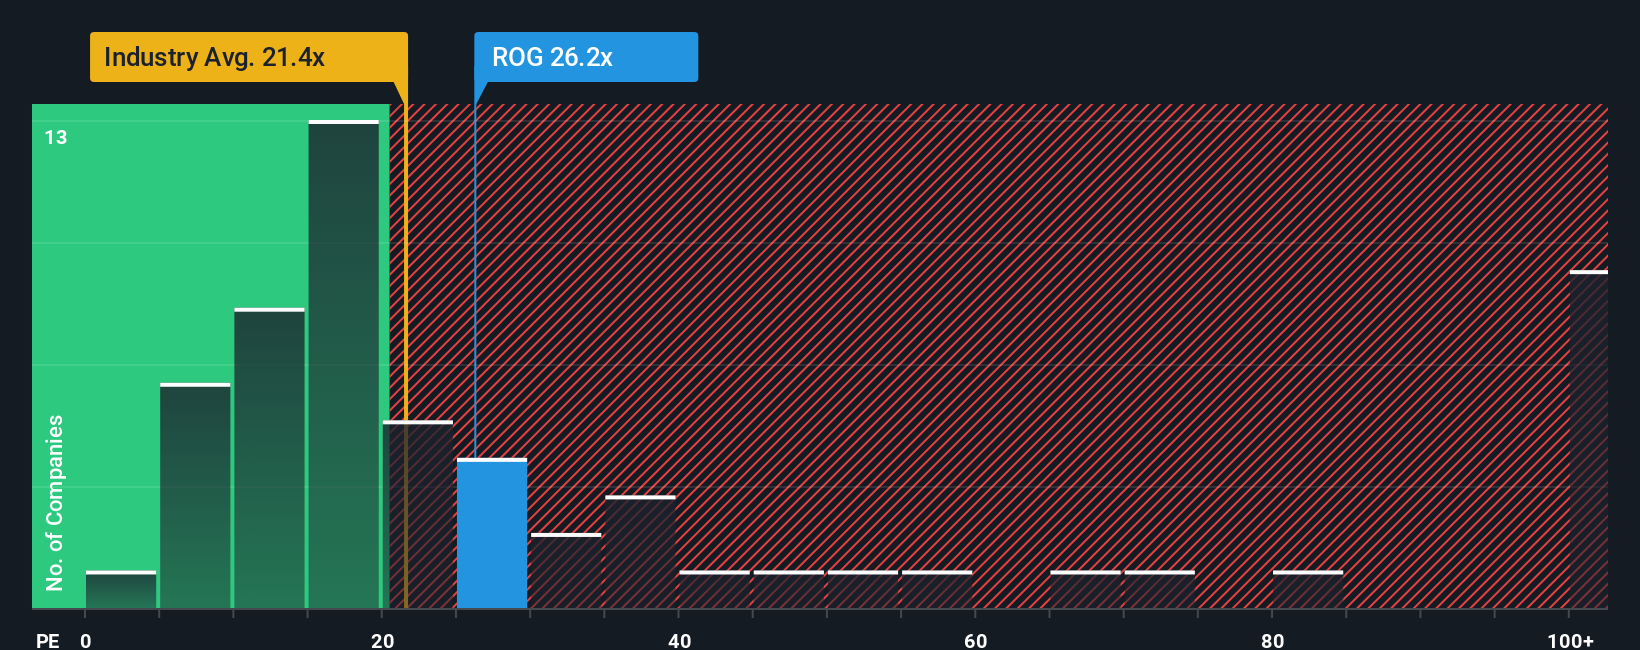
Roche Holding is currently trading at a PE ratio of 23.4x. This is just below the average for global pharmaceutical peers (76.5x) and closely aligned with the broader pharmaceuticals industry average (24.4x). However, simply comparing these numbers does not capture the company’s unique characteristics.
That is where Simply Wall St’s proprietary “Fair Ratio” comes into play. This metric incorporates Roche’s specific earnings growth outlook, profit margins, industry positioning, market cap, and potential risks, resulting in a tailored benchmark rather than a one-size-fits-all comparison. The Fair Ratio for Roche Holding is 33.7x.
Since Roche’s actual PE (23.4x) is well below its Fair Ratio (33.7x), the stock looks undervalued from this perspective, which may suggest the market is overlooking some of the company’s earnings potential and strengths.
Result: UNDERVALUED
PE ratios tell one story, but what if the real opportunity lies elsewhere? Discover 1411 companies where insiders are betting big on explosive growth.
Upgrade Your Decision Making: Choose your Roche Holding Narrative
Earlier we mentioned that there is an even better way to understand valuation. Let us introduce you to Narratives. A Narrative is simply your personal story or outlook on a company, where you describe not just the numbers but the reasons behind your expectations, such as your own view of Roche Holding's future revenue growth, earnings potential, and what drives its value.
Narratives connect the story you believe about a company, the financial forecasts that stem from that story, and the resulting fair value. This makes it easier to see the implications of your analysis. On the Simply Wall St platform's Community page, millions of investors use Narratives to make sense of market news and express unique perspectives, all with just a few clicks.
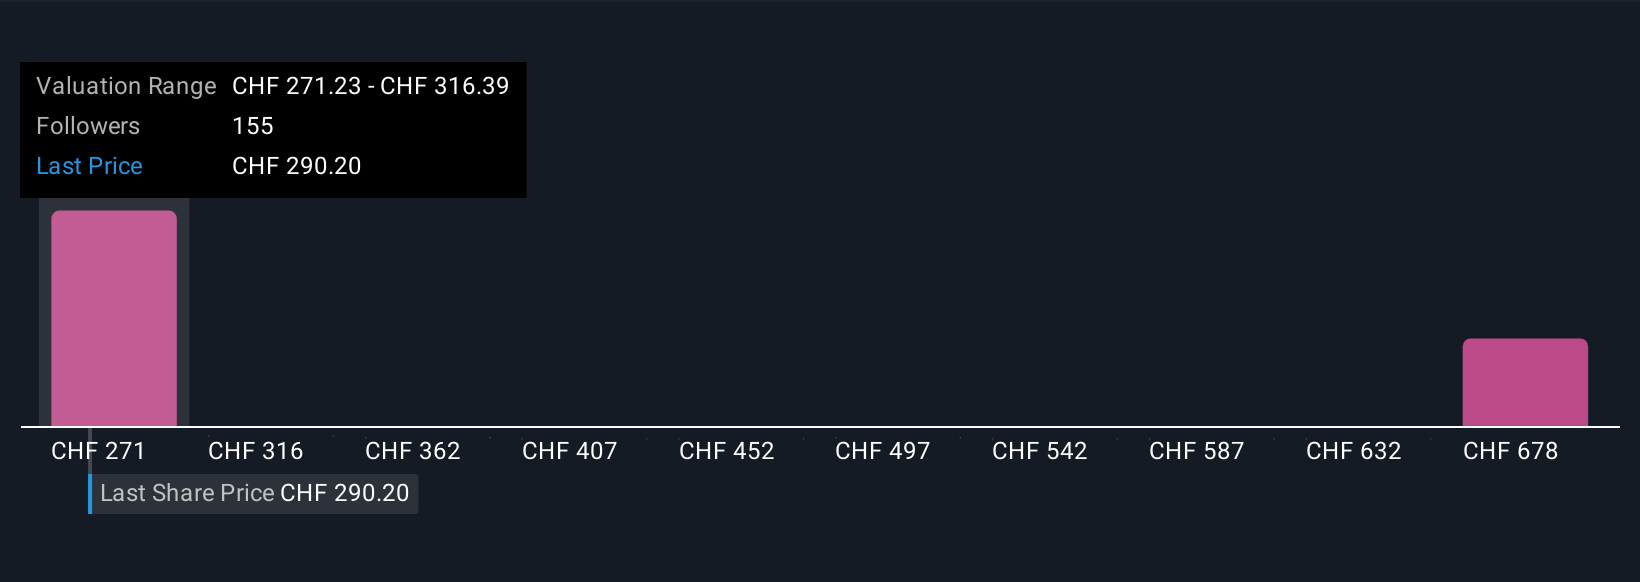
Narratives allow you to decide when to buy or sell by comparing your fair value with the current market price. The system updates dynamically as new news, earnings, or developments occur, so your analysis always stays current. For example, some investors believe Roche Holding is worth as little as CHF 230 if headwinds persist, while others see it as high as CHF 438 thanks to robust growth and new innovations.
Do you think there's more to the story for Roche Holding? Head over to our Community to see what others are saying!
This article by Simply Wall St is general in nature. We provide commentary based on historical data and analyst forecasts only using an unbiased methodology and our articles are not intended to be financial advice. It does not constitute a recommendation to buy or sell any stock, and does not take account of your objectives, or your financial situation. We aim to bring you long-term focused analysis driven by fundamental data. Note that our analysis may not factor in the latest price-sensitive company announcements or qualitative material. Simply Wall St has no position in any stocks mentioned.
New: AI Stock Screener & Alerts
Our new AI Stock Screener scans the market every day to uncover opportunities.
• Dividend Powerhouses (3%+ Yield)
• Undervalued Small Caps with Insider Buying
• High growth Tech and AI Companies
Or build your own from over 50 metrics.
Have feedback on this article? Concerned about the content? Get in touch with us directly. Alternatively, email editorial-team@simplywallst.com
About SWX:ROG
Roche Holding
Engages in the pharmaceuticals and diagnostics businesses in Europe, North America, Latin America, Asia, Africa, Australia, and New Zealand.
Established dividend payer and good value.
Similar Companies
Market Insights

Advertisement
Community Narratives
The company that turned a verb into a global necessity and basically runs the modern internet, digital ads, smartphones, maps, and AI.
Fair Value US$300.00|5.4% undervalued
OS
Community Contributor
Flowers Foods Pays A Fair Price For Health
Fair Value US$16.12|26.3% undervalued
NV
Community Contributor
TMX Group will thrive with 33.3% profit margin and enduring market moat
Fair Value CA$49.90|4.1% overvalued
LI
Community Contributor
The "Molecular Pencil": Why Beam's Technology is Built to Win
Fair Value US$65.01|62.7% undervalued
DA
Community Contributor