
Advertisement
- Switzerland
- /
- Medical Equipment
- /
- SWX:MOVE
Is Medacta Group SA's (VTX:MOVE) Stock's Recent Performance Being Led By Its Attractive Financial Prospects?
Most readers would already be aware that Medacta Group's (VTX:MOVE) stock increased significantly by 11% over the past month. Since the market usually pay for a company’s long-term fundamentals, we decided to study the company’s key performance indicators to see if they could be influencing the market. Particularly, we will be paying attention to Medacta Group's ROE today.
Return on equity or ROE is a key measure used to assess how efficiently a company's management is utilizing the company's capital. Put another way, it reveals the company's success at turning shareholder investments into profits.
How To Calculate Return On Equity?
The formula for return on equity is:
Return on Equity = Net Profit (from continuing operations) ÷ Shareholders' Equity
So, based on the above formula, the ROE for Medacta Group is:
19% = €73m ÷ €380m (Based on the trailing twelve months to December 2024).
The 'return' refers to a company's earnings over the last year. So, this means that for every CHF1 of its shareholder's investments, the company generates a profit of CHF0.19.
View our latest analysis for Medacta Group
What Has ROE Got To Do With Earnings Growth?
We have already established that ROE serves as an efficient profit-generating gauge for a company's future earnings. Based on how much of its profits the company chooses to reinvest or "retain", we are then able to evaluate a company's future ability to generate profits. Assuming all else is equal, companies that have both a higher return on equity and higher profit retention are usually the ones that have a higher growth rate when compared to companies that don't have the same features.
A Side By Side comparison of Medacta Group's Earnings Growth And 19% ROE
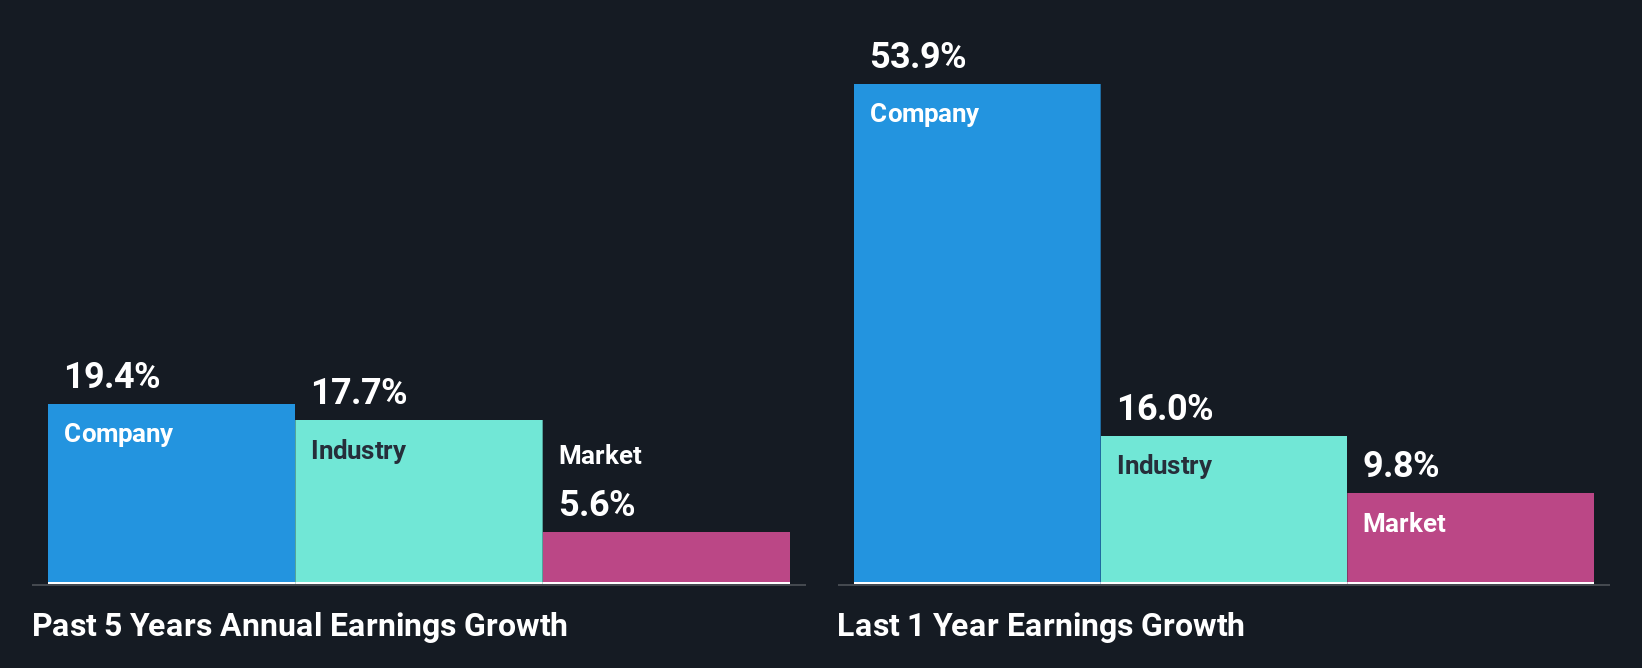
To start with, Medacta Group's ROE looks acceptable. Further, the company's ROE compares quite favorably to the industry average of 13%. This certainly adds some context to Medacta Group's decent 19% net income growth seen over the past five years.
Next, on comparing Medacta Group's net income growth with the industry, we found that the company's reported growth is similar to the industry average growth rate of 18% over the last few years.
The basis for attaching value to a company is, to a great extent, tied to its earnings growth. What investors need to determine next is if the expected earnings growth, or the lack of it, is already built into the share price. Doing so will help them establish if the stock's future looks promising or ominous. One good indicator of expected earnings growth is the P/E ratio which determines the price the market is willing to pay for a stock based on its earnings prospects. So, you may want to check if Medacta Group is trading on a high P/E or a low P/E, relative to its industry.
Is Medacta Group Making Efficient Use Of Its Profits?
Medacta Group's three-year median payout ratio to shareholders is 22% (implying that it retains 78% of its income), which is on the lower side, so it seems like the management is reinvesting profits heavily to grow its business.
Moreover, Medacta Group is determined to keep sharing its profits with shareholders which we infer from its long history of three years of paying a dividend. Our latest analyst data shows that the future payout ratio of the company over the next three years is expected to be approximately 19%. As a result, Medacta Group's ROE is not expected to change by much either, which we inferred from the analyst estimate of 20% for future ROE.
Summary
On the whole, we feel that Medacta Group's performance has been quite good. Particularly, we like that the company is reinvesting heavily into its business, and at a high rate of return. Unsurprisingly, this has led to an impressive earnings growth. We also studied the latest analyst forecasts and found that the company's earnings growth is expected be similar to its current growth rate. Are these analysts expectations based on the broad expectations for the industry, or on the company's fundamentals? Click here to be taken to our analyst's forecasts page for the company.
New: Manage All Your Stock Portfolios in One Place
We've created the ultimate portfolio companion for stock investors, and it's free.
• Connect an unlimited number of Portfolios and see your total in one currency
• Be alerted to new Warning Signs or Risks via email or mobile
• Track the Fair Value of your stocks
Have feedback on this article? Concerned about the content? Get in touch with us directly. Alternatively, email editorial-team (at) simplywallst.com.
This article by Simply Wall St is general in nature. We provide commentary based on historical data and analyst forecasts only using an unbiased methodology and our articles are not intended to be financial advice. It does not constitute a recommendation to buy or sell any stock, and does not take account of your objectives, or your financial situation. We aim to bring you long-term focused analysis driven by fundamental data. Note that our analysis may not factor in the latest price-sensitive company announcements or qualitative material. Simply Wall St has no position in any stocks mentioned.
About SWX:MOVE
Medacta Group
Develops, manufactures, and distributes orthopedic and neurosurgical medical devices Latin America, North America, the Asia-Pacific, and Middle East and Africa.
Outstanding track record with excellent balance sheet.
Similar Companies
Market Insights

Advertisement
Community Narratives
MINISO's fair value is projected at 26.69 with an anticipated PE ratio shift of 20x
Fair Value US$24.03|9.0% undervalued
BE
Community Contributor
Procter & Gamble: A Dividend Giant Facing Slowing Growth
Fair Value US$119.81|23.5% overvalued
AN
Community Contributor
Eli Lilly's Future Growth Driven by Tirzepatide and Favorable Market Conditions
Fair Value US$1.19k|14.4% undervalued
EA
Community Contributor