- Switzerland
- /
- Medical Equipment
- /
- SWX:MOVE
Is Medacta Group SA's (VTX:MOVE) Latest Stock Performance A Reflection Of Its Financial Health?

Most readers would already be aware that Medacta Group's (VTX:MOVE) stock increased significantly by 15% over the past three months. Since the market usually pay for a company’s long-term fundamentals, we decided to study the company’s key performance indicators to see if they could be influencing the market. Particularly, we will be paying attention to Medacta Group's ROE today.
Return on equity or ROE is an important factor to be considered by a shareholder because it tells them how effectively their capital is being reinvested. Simply put, it is used to assess the profitability of a company in relation to its equity capital.
See our latest analysis for Medacta Group
How To Calculate Return On Equity?
ROE can be calculated by using the formula:
Return on Equity = Net Profit (from continuing operations) ÷ Shareholders' Equity
So, based on the above formula, the ROE for Medacta Group is:
17% = €50m ÷ €298m (Based on the trailing twelve months to June 2023).
The 'return' refers to a company's earnings over the last year. That means that for every CHF1 worth of shareholders' equity, the company generated CHF0.17 in profit.
What Is The Relationship Between ROE And Earnings Growth?
Thus far, we have learned that ROE measures how efficiently a company is generating its profits. Depending on how much of these profits the company reinvests or "retains", and how effectively it does so, we are then able to assess a company’s earnings growth potential. Assuming everything else remains unchanged, the higher the ROE and profit retention, the higher the growth rate of a company compared to companies that don't necessarily bear these characteristics.
A Side By Side comparison of Medacta Group's Earnings Growth And 17% ROE
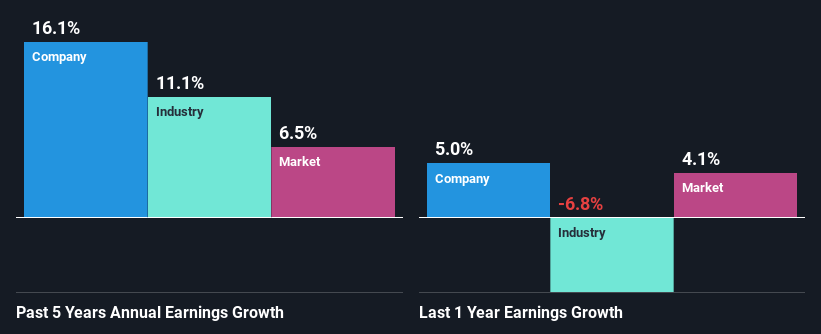
To begin with, Medacta Group seems to have a respectable ROE. And on comparing with the industry, we found that the the average industry ROE is similar at 17%. Consequently, this likely laid the ground for the decent growth of 16% seen over the past five years by Medacta Group.
As a next step, we compared Medacta Group's net income growth with the industry, and pleasingly, we found that the growth seen by the company is higher than the average industry growth of 11%.
Earnings growth is a huge factor in stock valuation. What investors need to determine next is if the expected earnings growth, or the lack of it, is already built into the share price. This then helps them determine if the stock is placed for a bright or bleak future. Has the market priced in the future outlook for MOVE? You can find out in our latest intrinsic value infographic research report.
Is Medacta Group Using Its Retained Earnings Effectively?
In Medacta Group's case, its respectable earnings growth can probably be explained by its low three-year median payout ratio of 22% (or a retention ratio of 78%), which suggests that the company is investing most of its profits to grow its business.
While Medacta Group has been growing its earnings, it only recently started to pay dividends which likely means that the company decided to impress new and existing shareholders with a dividend. Upon studying the latest analysts' consensus data, we found that the company is expected to keep paying out approximately 20% of its profits over the next three years. However, Medacta Group's ROE is predicted to rise to 22% despite there being no anticipated change in its payout ratio.
Summary
In total, we are pretty happy with Medacta Group's performance. In particular, it's great to see that the company is investing heavily into its business and along with a high rate of return, that has resulted in a sizeable growth in its earnings. That being so, the latest analyst forecasts show that the company will continue to see an expansion in its earnings. Are these analysts expectations based on the broad expectations for the industry, or on the company's fundamentals? Click here to be taken to our analyst's forecasts page for the company.
The New Payments ETF Is Live on NASDAQ:
Money is moving to real-time rails, and a newly listed ETF now gives investors direct exposure. Fast settlement. Institutional custody. Simple access.
Explore how this launch could reshape portfolios
Sponsored ContentNew: Manage All Your Stock Portfolios in One Place
We've created the ultimate portfolio companion for stock investors, and it's free.
• Connect an unlimited number of Portfolios and see your total in one currency
• Be alerted to new Warning Signs or Risks via email or mobile
• Track the Fair Value of your stocks
Have feedback on this article? Concerned about the content? Get in touch with us directly. Alternatively, email editorial-team (at) simplywallst.com.
This article by Simply Wall St is general in nature. We provide commentary based on historical data and analyst forecasts only using an unbiased methodology and our articles are not intended to be financial advice. It does not constitute a recommendation to buy or sell any stock, and does not take account of your objectives, or your financial situation. We aim to bring you long-term focused analysis driven by fundamental data. Note that our analysis may not factor in the latest price-sensitive company announcements or qualitative material. Simply Wall St has no position in any stocks mentioned.
About SWX:MOVE
Medacta Group
Develops, manufactures, and distributes orthopedic and neurosurgical medical devices Latin America, North America, the Asia-Pacific, and Middle East and Africa.
Outstanding track record with excellent balance sheet.
Similar Companies
Market Insights

Weekly Picks

Early mover in a fast growing industry. Likely to experience share price volatility as they scale


A case for CA$31.80 (undiluted), aka 8,616% upside from CA$0.37 (an 86 bagger!).


Moderation and Stabilisation: HOLD: Fair Price based on a 4-year Cycle is $12.08
Recently Updated Narratives

Airbnb Stock: Platform Growth in a World of Saturation and Scrutiny

Clarivate Stock: When Data Becomes the Backbone of Innovation and Law

Adobe Stock: AI-Fueled ARR Growth Pushes Guidance Higher, But Cost Pressures Loom
Popular Narratives


Crazy Undervalued 42 Baggers Silver Play (Active & Running Mine)


NVDA: Expanding AI Demand Will Drive Major Data Center Investments Through 2026


MicroVision will explode future revenue by 380.37% with a vision towards success
Trending Discussion
