Stock Analysis
- Switzerland
- /
- Healthcare Services
- /
- SWX:GALE
Galenica's (VTX:GALE) 12% CAGR outpaced the company's earnings growth over the same five-year period


Generally speaking the aim of active stock picking is to find companies that provide returns that are superior to the market average. Buying under-rated businesses is one path to excess returns. For example, long term Galenica AG (VTX:GALE) shareholders have enjoyed a 53% share price rise over the last half decade, well in excess of the market return of around 18% (not including dividends). However, more recent returns haven't been as impressive as that, with the stock returning just 6.8% in the last year, including dividends.
The past week has proven to be lucrative for Galenica investors, so let's see if fundamentals drove the company's five-year performance.
View our latest analysis for Galenica
There is no denying that markets are sometimes efficient, but prices do not always reflect underlying business performance. One way to examine how market sentiment has changed over time is to look at the interaction between a company's share price and its earnings per share (EPS).
During five years of share price growth, Galenica achieved compound earnings per share (EPS) growth of 2.0% per year. This EPS growth is slower than the share price growth of 9% per year, over the same period. This suggests that market participants hold the company in higher regard, these days. And that's hardly shocking given the track record of growth.
The company's earnings per share (over time) is depicted in the image below (click to see the exact numbers).
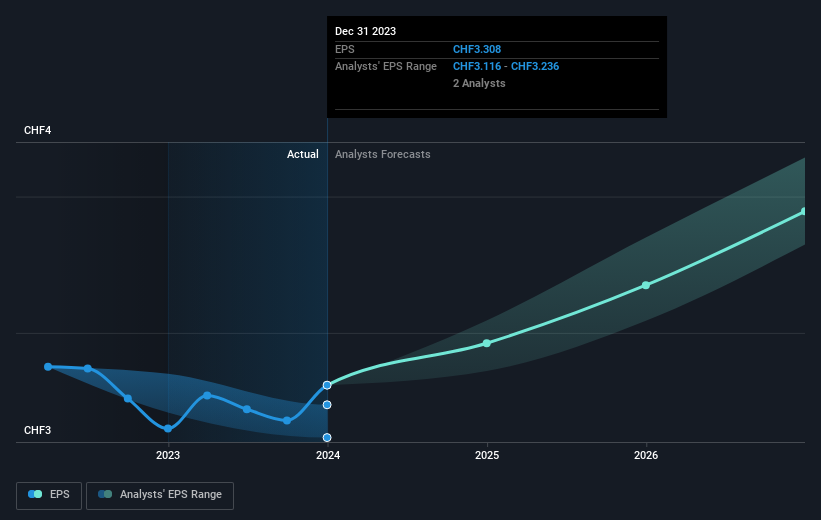
This free interactive report on Galenica's earnings, revenue and cash flow is a great place to start, if you want to investigate the stock further.
What About Dividends?
As well as measuring the share price return, investors should also consider the total shareholder return (TSR). Whereas the share price return only reflects the change in the share price, the TSR includes the value of dividends (assuming they were reinvested) and the benefit of any discounted capital raising or spin-off. So for companies that pay a generous dividend, the TSR is often a lot higher than the share price return. As it happens, Galenica's TSR for the last 5 years was 76%, which exceeds the share price return mentioned earlier. The dividends paid by the company have thusly boosted the total shareholder return.
A Different Perspective
It's nice to see that Galenica shareholders have received a total shareholder return of 6.8% over the last year. That's including the dividend. However, the TSR over five years, coming in at 12% per year, is even more impressive. The pessimistic view would be that be that the stock has its best days behind it, but on the other hand the price might simply be moderating while the business itself continues to execute. It's always interesting to track share price performance over the longer term. But to understand Galenica better, we need to consider many other factors. For instance, we've identified 1 warning sign for Galenica that you should be aware of.
If you like to buy stocks alongside management, then you might just love this free list of companies. (Hint: many of them are unnoticed AND have attractive valuation).
Please note, the market returns quoted in this article reflect the market weighted average returns of stocks that currently trade on Swiss exchanges.
Valuation is complex, but we're helping make it simple.
Find out whether Galenica is potentially over or undervalued by checking out our comprehensive analysis, which includes fair value estimates, risks and warnings, dividends, insider transactions and financial health.
View the Free AnalysisHave feedback on this article? Concerned about the content? Get in touch with us directly. Alternatively, email editorial-team (at) simplywallst.com.
This article by Simply Wall St is general in nature. We provide commentary based on historical data and analyst forecasts only using an unbiased methodology and our articles are not intended to be financial advice. It does not constitute a recommendation to buy or sell any stock, and does not take account of your objectives, or your financial situation. We aim to bring you long-term focused analysis driven by fundamental data. Note that our analysis may not factor in the latest price-sensitive company announcements or qualitative material. Simply Wall St has no position in any stocks mentioned.
About SWX:GALE
Galenica
Operates as a healthcare service provider in Switzerland and internationally.
Flawless balance sheet with solid track record.
