
Advertisement
- Switzerland
- /
- Luxury
- /
- SWX:UHR
Investors five-year losses continue as Swatch Group (VTX:UHR) dips a further 7.0% this week, earnings continue to decline

Ideally, your overall portfolio should beat the market average. But in any portfolio, there will be mixed results between individual stocks. So we wouldn't blame long term The Swatch Group AG (VTX:UHR) shareholders for doubting their decision to hold, with the stock down 41% over a half decade. And some of the more recent buyers are probably worried, too, with the stock falling 36% in the last year. Furthermore, it's down 16% in about a quarter. That's not much fun for holders.
If the past week is anything to go by, investor sentiment for Swatch Group isn't positive, so let's see if there's a mismatch between fundamentals and the share price.
Check out our latest analysis for Swatch Group
In his essay The Superinvestors of Graham-and-Doddsville Warren Buffett described how share prices do not always rationally reflect the value of a business. One way to examine how market sentiment has changed over time is to look at the interaction between a company's share price and its earnings per share (EPS).
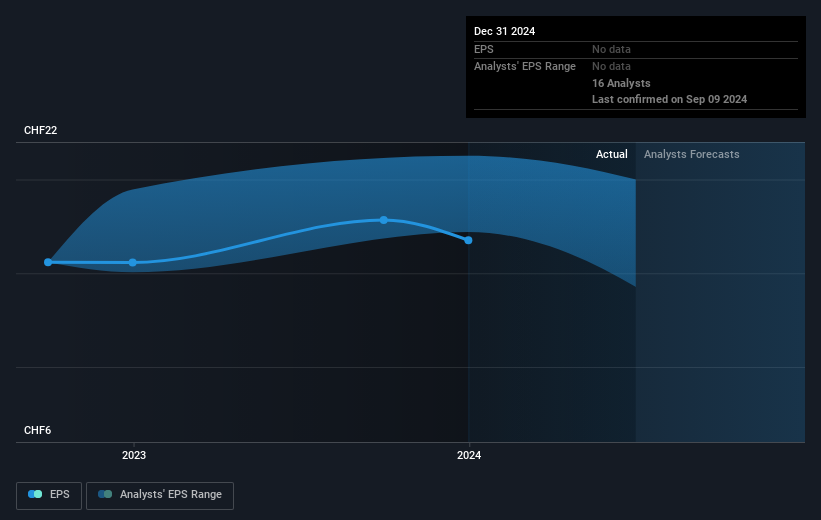
During the five years over which the share price declined, Swatch Group's earnings per share (EPS) dropped by 8.1% each year. Readers should note that the share price has fallen faster than the EPS, at a rate of 10% per year, over the period. This implies that the market is more cautious about the business these days.
The graphic below depicts how EPS has changed over time (unveil the exact values by clicking on the image).
This free interactive report on Swatch Group's earnings, revenue and cash flow is a great place to start, if you want to investigate the stock further.
What About Dividends?
When looking at investment returns, it is important to consider the difference between total shareholder return (TSR) and share price return. Whereas the share price return only reflects the change in the share price, the TSR includes the value of dividends (assuming they were reinvested) and the benefit of any discounted capital raising or spin-off. So for companies that pay a generous dividend, the TSR is often a lot higher than the share price return. As it happens, Swatch Group's TSR for the last 5 years was -34%, which exceeds the share price return mentioned earlier. The dividends paid by the company have thusly boosted the total shareholder return.
A Different Perspective
Investors in Swatch Group had a tough year, with a total loss of 34% (including dividends), against a market gain of about 9.7%. Even the share prices of good stocks drop sometimes, but we want to see improvements in the fundamental metrics of a business, before getting too interested. Regrettably, last year's performance caps off a bad run, with the shareholders facing a total loss of 6% per year over five years. We realise that Baron Rothschild has said investors should "buy when there is blood on the streets", but we caution that investors should first be sure they are buying a high quality business. It's always interesting to track share price performance over the longer term. But to understand Swatch Group better, we need to consider many other factors. Case in point: We've spotted 2 warning signs for Swatch Group you should be aware of.
Of course, you might find a fantastic investment by looking elsewhere. So take a peek at this free list of companies we expect will grow earnings.
Please note, the market returns quoted in this article reflect the market weighted average returns of stocks that currently trade on Swiss exchanges.
New: Manage All Your Stock Portfolios in One Place
We've created the ultimate portfolio companion for stock investors, and it's free.
• Connect an unlimited number of Portfolios and see your total in one currency
• Be alerted to new Warning Signs or Risks via email or mobile
• Track the Fair Value of your stocks
Have feedback on this article? Concerned about the content? Get in touch with us directly. Alternatively, email editorial-team (at) simplywallst.com.
This article by Simply Wall St is general in nature. We provide commentary based on historical data and analyst forecasts only using an unbiased methodology and our articles are not intended to be financial advice. It does not constitute a recommendation to buy or sell any stock, and does not take account of your objectives, or your financial situation. We aim to bring you long-term focused analysis driven by fundamental data. Note that our analysis may not factor in the latest price-sensitive company announcements or qualitative material. Simply Wall St has no position in any stocks mentioned.
About SWX:UHR
Swatch Group
Designs, manufactures, and sells finished watches, jewelry, and watch movements and components worldwide.
Flawless balance sheet with moderate growth potential.
Market Insights


Advertisement
Community Narratives
A case for TSXV:USA to reach USD $5.00 - $9.00 (CAD $7.30–$12.29) by 2029.
Fair Value CA$12.29|91.1% undervalued
AG
Community Contributor
DLocal's Future Growth Fueled by 35% Revenue and Profit Margin Boosts
Fair Value US$195.39|94.2% undervalued
WY
Community Contributor
Historically Cheap, but the Margin of Safety Is Still Thin
Fair Value SEK 232.58|13.2% undervalued
MA
Community Contributor